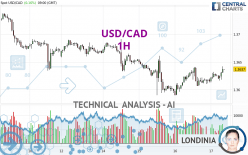
USD/CAD - 1H - Technical analysis published on 05/17/2024 (GMT)
- 97
- 0
Click here for a new analysis!
- Timeframe : 1H
- - Analysis generated on
- Status : INVALID

Summary of the analysis

Additional analysis
Quotes
USD/CAD rating 1.3637 CAD. The price has increased by +0.16% since the last closing with the lowest point at 1.3613 CAD and the highest point at 1.3642 CAD. The deviation from the price is +0.18% for the low point and -0.04% for the high point.A study of price movements over other periods shows the following variations:
Near a new LOW record (1 year)
Type : Bearish
Timeframe : Weekly
Near a new LOW record (1st january)
Type : Bearish
Timeframe : Weekly
Near a new HIGH record (1 month)
Type : Bullish
Timeframe : Weekly
Technical
Technical analysis of this 1H chart of USD/CAD indicates that the overall trend is not clearly defined. This indecision could turn into a bullish trend due to the strong bullish signals currently being given by short-term moving averages. The Central Indicators market scanner is currently detecting several bullish signals that could impact this trend:
Bullish trend reversal : adaptative moving average 50
Type : Bullish
Timeframe : 1 hour
Bullish price crossover with Moving Average 100
Type : Bullish
Timeframe : 1 hour
Bullish price crossover with adaptative moving average 100
Type : Bullish
Timeframe : 1 hour
In fact, according to the parameters integrated into the Central Analyzer system, 15 technical indicators out of 18 analysed are currently bullish. Caution: the Central Indicators scanner currently detects an excess:
CCI indicator is overbought : over 100
Type : Neutral
Timeframe : 1 hour
Williams %R indicator is overbought : over -20
Type : Neutral
Timeframe : 1 hour
Pivot points : price is over resistance 1
Type : Neutral
Timeframe : 1 hour
Parabolic SAR indicator bullish reversal
Type : Bullish
Timeframe : 1 hour
Ichimoku : price is over the cloud
Type : Bullish
Timeframe : 1 hour
Central Patterns, the market scanner focusing on chart patterns, resistances and supports found this result:
Near resistance of channel
Type : Bearish
Timeframe : 1 hour
The Central Candlesticks scanner, specialised in Japanese candlesticks, did not identify any signals.
| S3 | S2 | S1 | Price | R1 | R2 | R3 | |
|---|---|---|---|---|---|---|---|
| ProTrendLines | 1.3594 | 1.3607 | 1.3634 | 1.3637 | 1.3661 | 1.3686 | 1.3763 |
| Change (%) | -0.32% | -0.22% | -0.02% | - | +0.18% | +0.36% | +0.92% |
| Change | -0.0043 | -0.0030 | -0.0003 | - | +0.0024 | +0.0049 | +0.0126 |
| Level | Major | Minor | Intermediate | - | Minor | Major | Minor |
Attention could also be paid to pivot points to set price objectives:
| Pivot points | S3 | S2 | S1 | PP | R1 | R2 | R3 |
|---|---|---|---|---|---|---|---|
| Standard | 1.3539 | 1.3564 | 1.3590 | 1.3615 | 1.3641 | 1.3666 | 1.3692 |
| Camarilla | 1.3601 | 1.3606 | 1.3610 | 1.3615 | 1.3620 | 1.3624 | 1.3629 |
| Woodie | 1.3539 | 1.3564 | 1.3590 | 1.3615 | 1.3641 | 1.3666 | 1.3692 |
| Fibonacci | 1.3564 | 1.3584 | 1.3596 | 1.3615 | 1.3635 | 1.3647 | 1.3666 |
| Pivot points | S3 | S2 | S1 | PP | R1 | R2 | R3 |
|---|---|---|---|---|---|---|---|
| Standard | 1.3487 | 1.3561 | 1.3616 | 1.3690 | 1.3745 | 1.3819 | 1.3874 |
| Camarilla | 1.3637 | 1.3648 | 1.3660 | 1.3672 | 1.3684 | 1.3696 | 1.3708 |
| Woodie | 1.3479 | 1.3556 | 1.3608 | 1.3685 | 1.3737 | 1.3814 | 1.3866 |
| Fibonacci | 1.3561 | 1.3610 | 1.3640 | 1.3690 | 1.3739 | 1.3769 | 1.3819 |
| Pivot points | S3 | S2 | S1 | PP | R1 | R2 | R3 |
|---|---|---|---|---|---|---|---|
| Standard | 1.3187 | 1.3333 | 1.3555 | 1.3701 | 1.3923 | 1.4069 | 1.4291 |
| Camarilla | 1.3677 | 1.3711 | 1.3744 | 1.3778 | 1.3812 | 1.3846 | 1.3879 |
| Woodie | 1.3226 | 1.3352 | 1.3594 | 1.3720 | 1.3962 | 1.4088 | 1.4330 |
| Fibonacci | 1.3333 | 1.3473 | 1.3560 | 1.3701 | 1.3841 | 1.3928 | 1.4069 |
Numerical data
The following is the status of the technical indicators and moving averages at the time of publication of this technical analysis:
| RSI (14): | 62.86 | |
| MACD (12,26,9): | 0.0003 | |
| Directional Movement: | 7.9933 | |
| AROON (14): | 78.5714 | |
| DEMA (21): | 1.3626 | |
| Parabolic SAR (0,02-0,02-0,2): | 1.3610 | |
| Elder Ray (13): | 0.0011 | |
| Super Trend (3,10): | 1.3607 | |
| Zig ZAG (10): | 1.3638 | |
| VORTEX (21): | 1.0090 | |
| Stochastique (14,3,5): | 82.20 | |
| TEMA (21): | 1.3631 | |
| Williams %R (14): | -12.50 | |
| Chande Momentum Oscillator (20): | 0.0020 | |
| Repulse (5,40,3): | 0.1207 | |
| ROCnROLL: | 1 | |
| TRIX (15,9): | 0.0014 | |
| Courbe Coppock: | 0.14 |
| MA7: | 1.3646 | |
| MA20: | 1.3679 | |
| MA50: | 1.3632 | |
| MA100: | 1.3548 | |
| MAexp7: | 1.3628 | |
| MAexp20: | 1.3623 | |
| MAexp50: | 1.3626 | |
| MAexp100: | 1.3638 | |
| Price / MA7: | -0.07% | |
| Price / MA20: | -0.31% | |
| Price / MA50: | +0.04% | |
| Price / MA100: | +0.66% | |
| Price / MAexp7: | +0.07% | |
| Price / MAexp20: | +0.10% | |
| Price / MAexp50: | +0.08% | |
| Price / MAexp100: | -0.01% |
News
The latest news and videos published on USD/CAD at the time of the analysis were as follows:
-
 USD/CAD Forecast May 17, 2024
-
Trade of the Week: Time to go long USDCAD?
-
USD/CAD Forecast May 8, 2024
-
USD/CAD Forecast May 2, 2024
-
USD/CAD Forecast April 10, 2024
About author

Online


Add a comment
Comments
0 comments on the analysis USD/CAD - 1H