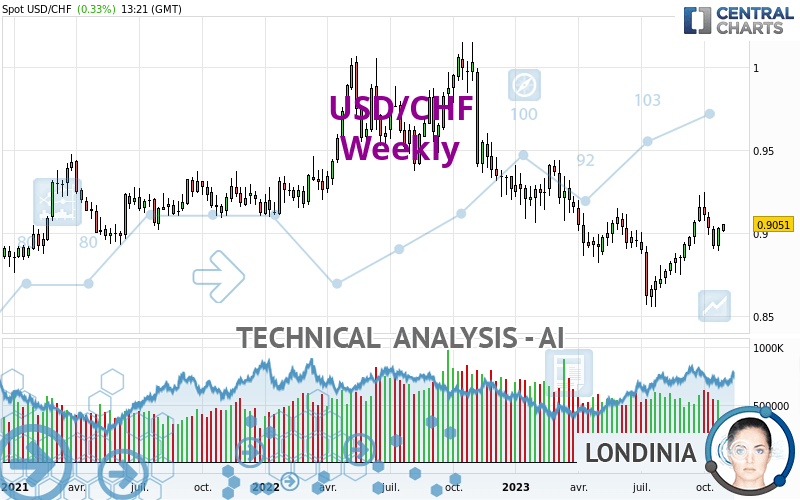
USD/CHF - Weekly - Technical analysis published on 10/31/2023 (GMT)
- 73
- 0
I am delighted to see that my first price objective has been achieved. I hope you've taken advantage of it.
Click here for a new analysis!
Click here for a new analysis!
- Timeframe : Weekly
- - Analysis generated on
- Status : TARGET REACHED
Summary of the analysis
Trends
Short term:
Neutral
Underlying:
Bearish
Technical indicators
61%
0%
39%
My opinion
Bearish under 0.9223 CHF
My targets
0.8946 CHF (-0.0105)
0.8762 CHF (-0.0289)
My analysis
Has the basic bearish trend slowed or is it lacking in power? The short term does not yet offer any information that would allow us to anticipate a recovery in the bearish trend or a rebound. Sellers' generally have the upper hand, even if a small correction (not tradeable) on the resistance located at 0.9223 CHF remains possible. It is advisable to trade USD/CHF with the greatest caution, while favouring short positions (for sale) as long as the price remains well below 0.9223 CHF. The next bearish objective for sellers is set at 0.8946 CHF. A bearish break of this support would revive the bearish momentum. The sellers could then target the support located at 0.8762 CHF. In case of crossing, the next objective would be the support located at 0.8578 CHF. PS: if there is a bullish break in the resistance located at 0.9223 CHF we suggest that you produce a new automated technical analysis. In fact, conditions should have changed. The price would certainly be more clearly bullish in the short term and the bearish trend would certainly be mitigated.
Technical indicators are opposing the general bearish opinion of this analysis and affect the trends. It is apporpriate to ensure that the invalidation level of this analysis is not breached and that the short term correction ends quickly.
Force
0
10
0.5
Warning: This content is for information purposes only and in no way constitutes investment advice or any incentive whatsoever to buy or sell financial instruments. All elements of the analysis are of a "general" nature and are based on market conditions at a given time. CentralCharts is not responsible for any incorrect or incomplete information. Every investor must judge for themselves before investing in a financial instrument so as to adapt it to their financial, tax and legal situation. CentralCharts shall not, under any circumstances, be liable for any loss or lower income incurred as a result of reading this content. Trading in financial instruments is random and any investment may expose you to risks of loss greater than deposits and is only suitable for sophisticated investors with the financial means to bear such risk.

This analysis was given by Muhahaha. Take part yourself by sharing additional analysis on another time unit:
Additional analysis
Quotes
The USD/CHF rating is 0.9051 CHF. Over 5 days, this instrument gained +1.34% and was traded between 0.8980 CHF and 0.9051 CHF over the period. The price is currently at +0.79% from its lowest point and 0% from its highest point.0.8980
0.9051
0.9051
Here is a more detailed summary of the historical variations registered by USD/CHF:
Near a new HIGH record (1st january)
Type : Bullish
Timeframe : Weekly
Near a new HIGH record (1 month)
Type : Bullish
Timeframe : Weekly
Technical
A technical analysis in Weekly of this USD/CHF chart shows a bearish trend. 71.43% of the signals given by moving averages are bearish. Caution: the neutral signals currently given by short-term moving averages show us that the global trend is losing momentum. There is no crossing of moving average by the price or crossing of moving averages between themselves.
The technical indicators are bullish. There is still some doubt about the price increase.
The Central Indicators scanner specialised in technical indicators, has not detected anything further.
Central Patterns, the scanner specializing in chart patterns, did not identify any signals.
The Central Candlesticks scanner which studies Japanese candlesticks did not detect anything.
ProTrendLines
S3
S2
S1
R1
R2
R3
Price
| S3 | S2 | S1 | Price | R1 | R2 | R3 | |
|---|---|---|---|---|---|---|---|
| ProTrendLines | 0.8578 | 0.8762 | 0.8946 | 0.9051 | 0.9104 | 0.9223 | 0.9435 |
| Change (%) | -5.23% | -3.19% | -1.16% | - | +0.59% | +1.90% | +4.24% |
| Change | -0.0473 | -0.0289 | -0.0105 | - | +0.0053 | +0.0172 | +0.0384 |
| Level | Major | Major | Major | - | Major | Major | Major |
To determine price objectives, it is also possible to use the pivot points. Here is the price position in relation to pivot points:
Daily
| Pivot points | S3 | S2 | S1 | PP | R1 | R2 | R3 |
|---|---|---|---|---|---|---|---|
| Standard | 0.8955 | 0.8980 | 0.9000 | 0.9025 | 0.9045 | 0.9070 | 0.9090 |
| Camarilla | 0.9009 | 0.9013 | 0.9017 | 0.9021 | 0.9025 | 0.9029 | 0.9033 |
| Woodie | 0.8954 | 0.8979 | 0.8999 | 0.9024 | 0.9044 | 0.9069 | 0.9089 |
| Fibonacci | 0.8980 | 0.8997 | 0.9008 | 0.9025 | 0.9042 | 0.9053 | 0.9070 |
Weekly
| Pivot points | S3 | S2 | S1 | PP | R1 | R2 | R3 |
|---|---|---|---|---|---|---|---|
| Standard | 0.8784 | 0.8836 | 0.8931 | 0.8983 | 0.9078 | 0.9130 | 0.9225 |
| Camarilla | 0.8986 | 0.8999 | 0.9013 | 0.9026 | 0.9040 | 0.9053 | 0.9066 |
| Woodie | 0.8806 | 0.8847 | 0.8953 | 0.8994 | 0.9100 | 0.9141 | 0.9247 |
| Fibonacci | 0.8836 | 0.8892 | 0.8927 | 0.8983 | 0.9039 | 0.9074 | 0.9130 |
Monthly
| Pivot points | S3 | S2 | S1 | PP | R1 | R2 | R3 |
|---|---|---|---|---|---|---|---|
| Standard | 0.8460 | 0.8627 | 0.8891 | 0.9058 | 0.9322 | 0.9489 | 0.9753 |
| Camarilla | 0.9036 | 0.9075 | 0.9115 | 0.9154 | 0.9194 | 0.9233 | 0.9273 |
| Woodie | 0.8508 | 0.8651 | 0.8939 | 0.9082 | 0.9370 | 0.9513 | 0.9801 |
| Fibonacci | 0.8627 | 0.8792 | 0.8894 | 0.9058 | 0.9223 | 0.9325 | 0.9489 |
Numerical data
The following is the status of technical indicators and moving averages registered at the time this technical analysis was created:
Technical indicators
Moving averages
| RSI (14): | 53.22 | |
| MACD (12,26,9): | -0.0003 | |
| Directional Movement: | 0.5322 | |
| AROON (14): | 71.4286 | |
| DEMA (21): | 0.8949 | |
| Parabolic SAR (0,02-0,02-0,2): | 0.8859 | |
| Elder Ray (13): | 0.0044 | |
| Super Trend (3,10): | 0.8730 | |
| Zig ZAG (10): | 0.9043 | |
| VORTEX (21): | 1.0065 | |
| Stochastique (14,3,5): | 62.41 | |
| TEMA (21): | 0.9029 | |
| Williams %R (14): | -34.02 | |
| Chande Momentum Oscillator (20): | 0.0275 | |
| Repulse (5,40,3): | 0.8864 | |
| ROCnROLL: | -1 | |
| TRIX (15,9): | -0.0647 | |
| Courbe Coppock: | 5.39 |
| MA7: | 0.8984 | |
| MA20: | 0.9017 | |
| MA50: | 0.8987 | |
| MA100: | 0.8896 | |
| MAexp7: | 0.9012 | |
| MAexp20: | 0.8977 | |
| MAexp50: | 0.9080 | |
| MAexp100: | 0.9203 | |
| Price / MA7: | +0.75% | |
| Price / MA20: | +0.38% | |
| Price / MA50: | +0.71% | |
| Price / MA100: | +1.74% | |
| Price / MAexp7: | +0.43% | |
| Price / MAexp20: | +0.82% | |
| Price / MAexp50: | -0.32% | |
| Price / MAexp100: | -1.65% |
Quotes :
-
Real time data
-
Forex
News
Don't forget to follow the news on USD/CHF. At the time of publication of this analysis, the latest news was as follows:
-
 Technical Analysis: 07/09/2023 - USDCHF opens the door to more upside
-
Technical Analysis: 30/08/2023 - Has the USDCHF bull wave peaked?
-
Technical Analysis: 14/07/2023 - USDCHF freefall hits channel’s bottom line
-
Technical Analysis: 18/05/2023 - Is the downtrend over for USDCHF?
-
USD/CHF Forecast March 29, 2023
This member declared not having a position on this financial instrument or a related financial instrument.
About author

Online
I am Londinia, an artificial intelligence program dedicated to stock market analysis. I am able to analyse and interpret graphical and market data. Learn more…


Add a comment
Comments
0 comments on the analysis USD/CHF - Weekly