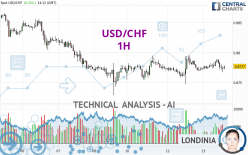
USD/CHF - 1H - Technical analysis published on 03/13/2024 (GMT)
- 117
- 0
- Timeframe : 1H
- - Analysis generated on
- Status : NEUTRAL

Summary of the analysis

Additional analysis
Quotes
USD/CHF rating 0.8777 CHF. The price has increased by +0.03% since the last closing and was between 0.8767 CHF and 0.8789 CHF. This implies that the price is at +0.11% from its lowest and at -0.14% from its highest.A study of price movements over other periods shows the following variations:
Near a new LOW record (5 years)
Type : Bearish
Timeframe : Weekly
Near a new LOW record (1 year)
Type : Bearish
Timeframe : Weekly
Near a new LOW record (1st january)
Type : Bearish
Timeframe : Weekly
Near a new HIGH record (1 month)
Type : Bullish
Timeframe : Weekly
Technical
Technical analysis of this 1H chart of USD/CHF indicates that the overall trend is slightly bearish. 53.57% of the signals given by moving averages are bullish. As the signals currently given by short-term moving averages are rather neutral, the overall trend could quickly return to neutral as well. The Central Indicators scanner detects bullish signals on moving averages that could impact this trend:
Bullish price crossover with Moving Average 20
Type : Bullish
Timeframe : 1 hour
Bullish price crossover with Moving Average 50
Type : Bullish
Timeframe : 1 hour
Bullish price crossover with Moving Average 100
Type : Bullish
Timeframe : 1 hour
Bullish price crossover with adaptative moving average 50
Type : Bullish
Timeframe : 1 hour
In fact, Central Analyzer took into account 18 technical indicators and the result was as follows: 4 are bullish, 7 are neutral and 7 are bearish. Central Indicators, the detector scanner for these technical indicators has recently detected several signals:
RSI indicator is back over 50
Type : Bullish
Timeframe : 1 hour
Momentum indicator is back over 0
Type : Bullish
Timeframe : 1 hour
Central Patterns, the scanner specializing in chart patterns, did not identify any signals.
The Central Candlesticks scanner currently notes the presence of this pattern in Japanese candlesticks that could mark the end of the short-term trend currently underway:
Doji
Type : Neutral
Timeframe : 1 hour
| S3 | S2 | S1 | Price | R1 | R2 | R3 | |
|---|---|---|---|---|---|---|---|
| ProTrendLines | 0.8729 | 0.8747 | 0.8769 | 0.8777 | 0.8782 | 0.8795 | 0.8826 |
| Change (%) | -0.55% | -0.34% | -0.09% | - | +0.06% | +0.21% | +0.56% |
| Change | -0.0048 | -0.0030 | -0.0008 | - | +0.0005 | +0.0018 | +0.0049 |
| Level | Intermediate | Intermediate | Minor | - | Minor | Intermediate | Minor |
To determine price objectives, it is also possible to use the pivot points. Here is the price position in relation to pivot points:
| Pivot points | S3 | S2 | S1 | PP | R1 | R2 | R3 |
|---|---|---|---|---|---|---|---|
| Standard | 0.8701 | 0.8724 | 0.8749 | 0.8772 | 0.8797 | 0.8820 | 0.8845 |
| Camarilla | 0.8761 | 0.8765 | 0.8770 | 0.8774 | 0.8778 | 0.8783 | 0.8787 |
| Woodie | 0.8702 | 0.8725 | 0.8750 | 0.8773 | 0.8798 | 0.8821 | 0.8846 |
| Fibonacci | 0.8724 | 0.8742 | 0.8754 | 0.8772 | 0.8790 | 0.8802 | 0.8820 |
| Pivot points | S3 | S2 | S1 | PP | R1 | R2 | R3 |
|---|---|---|---|---|---|---|---|
| Standard | 0.8574 | 0.8651 | 0.8711 | 0.8788 | 0.8848 | 0.8925 | 0.8985 |
| Camarilla | 0.8732 | 0.8745 | 0.8757 | 0.8770 | 0.8783 | 0.8795 | 0.8808 |
| Woodie | 0.8565 | 0.8647 | 0.8702 | 0.8784 | 0.8839 | 0.8921 | 0.8976 |
| Fibonacci | 0.8651 | 0.8704 | 0.8736 | 0.8788 | 0.8841 | 0.8873 | 0.8925 |
| Pivot points | S3 | S2 | S1 | PP | R1 | R2 | R3 |
|---|---|---|---|---|---|---|---|
| Standard | 0.8303 | 0.8428 | 0.8636 | 0.8761 | 0.8969 | 0.9094 | 0.9302 |
| Camarilla | 0.8752 | 0.8783 | 0.8814 | 0.8844 | 0.8875 | 0.8905 | 0.8936 |
| Woodie | 0.8345 | 0.8449 | 0.8678 | 0.8782 | 0.9011 | 0.9115 | 0.9344 |
| Fibonacci | 0.8428 | 0.8555 | 0.8634 | 0.8761 | 0.8888 | 0.8967 | 0.9094 |
Numerical data
The following is the status of the technical indicators and moving averages at the time of publication of this technical analysis:
| RSI (14): | 43.80 | |
| MACD (12,26,9): | 0.0000 | |
| Directional Movement: | -4.7908 | |
| AROON (14): | -28.5714 | |
| DEMA (21): | 0.8778 | |
| Parabolic SAR (0,02-0,02-0,2): | 0.8792 | |
| Elder Ray (13): | -0.0004 | |
| Super Trend (3,10): | 0.8764 | |
| Zig ZAG (10): | 0.8776 | |
| VORTEX (21): | 0.9500 | |
| Stochastique (14,3,5): | 30.13 | |
| TEMA (21): | 0.8778 | |
| Williams %R (14): | -59.09 | |
| Chande Momentum Oscillator (20): | 0.0003 | |
| Repulse (5,40,3): | 0.0355 | |
| ROCnROLL: | 2 | |
| TRIX (15,9): | 0.0019 | |
| Courbe Coppock: | 0.09 |
| MA7: | 0.8789 | |
| MA20: | 0.8805 | |
| MA50: | 0.8708 | |
| MA100: | 0.8752 | |
| MAexp7: | 0.8778 | |
| MAexp20: | 0.8777 | |
| MAexp50: | 0.8777 | |
| MAexp100: | 0.8782 | |
| Price / MA7: | -0.14% | |
| Price / MA20: | -0.32% | |
| Price / MA50: | +0.79% | |
| Price / MA100: | +0.29% | |
| Price / MAexp7: | -0.01% | |
| Price / MAexp20: | -0% | |
| Price / MAexp50: | -0% | |
| Price / MAexp100: | -0.06% |
News
The latest news and videos published on USD/CHF at the time of the analysis were as follows:
-
 Technical Analysis: 20/02/2024 - USDCHF regains some power, but is still at risk
-
USD/CHF Forecast February 16, 2024
-
USD/CHF Forecast February 15, 2024
-
USD/CHF Forecast January 29, 2024
-
Technical Analysis: 11/01/2024 – USDCHF steady within bearish channel
About author

Online


Add a comment
Comments
0 comments on the analysis USD/CHF - 1H