USD/JPY - USD/JPY is Finding Resistance Near 118.65 - 12/21/2016 (GMT)
- Who voted?
- 391
- 0
- Timeframe : Daily

USD/JPY Chart
Are you looking for opportunities in indices and forex?
DISCOVER LONDINIA OPPORTUNITIES...
DISCOVER LONDINIA OPPORTUNITIES...
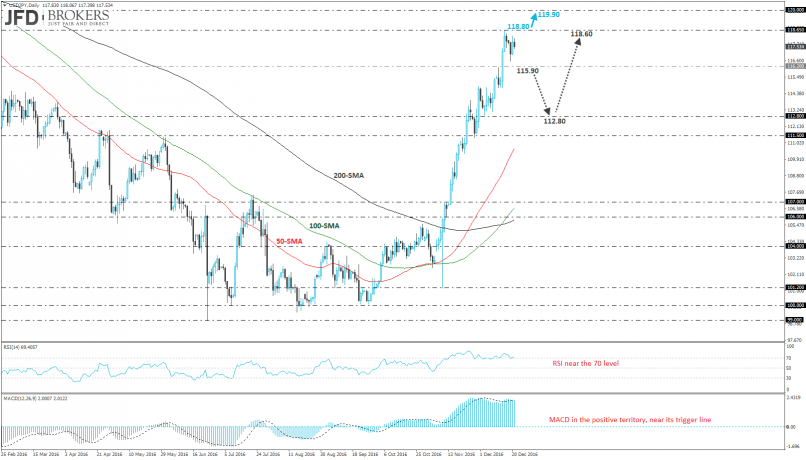
The USD/JPY is rising sharply the last two months, more than 15%, without serious retracements. Currently, the pair is trading above all the three SMAs on the daily chart (50, 100 and 200 SMAs) and is finding resistance at the 118.80 level.
A battle will take place there, between the bulls and the bears, and if we see a successful surpass of that barrier, the price will be exposed up to the psychological level at 120.00. Otherwise, if the pair slips below 116.00, we will see the first significant retracement until the 112.80 level, before it continues north. The RSI is moving near its 70 level, while the MACD is in the positive territory, surrounding its trigger line.
A battle will take place there, between the bulls and the bears, and if we see a successful surpass of that barrier, the price will be exposed up to the psychological level at 120.00. Otherwise, if the pair slips below 116.00, we will see the first significant retracement until the 112.80 level, before it continues north. The RSI is moving near its 70 level, while the MACD is in the positive territory, surrounding its trigger line.
This member did not declare if he had a position on this financial instrument or a related financial instrument.
About author

Offline


Add a comment
Comments
0 comments on the analysis USD/JPY - Daily