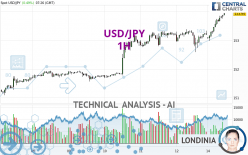
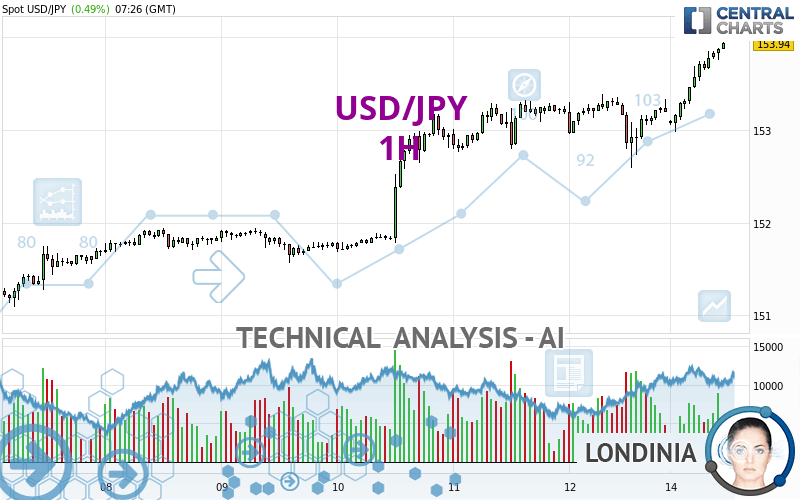
USD/JPY - 1H - Technical analysis published on 04/15/2024 (GMT)
- 83
- 0
Click here for a new analysis!
- Timeframe : 1H
- - Analysis generated on
- Status : LEVEL MAINTAINED
Summary of the analysis

Additional analysis
Quotes
The USD/JPY rating is 153.94 JPY. The price has increased by +0.49% since the last closing and was between 152.98 JPY and 153.95 JPY. This implies that the price is at +0.63% from its lowest and at -0.01% from its highest.The Central Gaps scanner detects a bearish opening. A small advantage for sellers in the very short term.
Bearish opening
Type : Bearish
Timeframe : Openning
Here is a more detailed summary of the historical variations registered by USD/JPY:
New HIGH record (5 years)
Type : Bullish
Timeframe : Weekly
New HIGH record (1 year)
Type : Bullish
Timeframe : Weekly
New HIGH record (1st january)
Type : Bullish
Timeframe : Weekly
New HIGH record (1 month)
Type : Bullish
Timeframe : Weekly
Technical
Technical analysis of USD/JPY in 1H shows a strongly overall bullish trend. 92.86% of the signals given by moving averages are bullish. This strongly bullish trend is supported by the strong bullish signals given by short-term moving averages. The Central Indicators market scanner is currently detecting a bearish signal that could impact this trend:
Moving Average bearish crossovers : AMA50 & AMA100
Type : Bearish
Timeframe : 1 hour
The probability of a further increase is high given the direction of the technical indicators.
But beware of excesses. The Central Indicators scanner currently detects this:
RSI indicator is overbought : over 70
Type : Neutral
Timeframe : 1 hour
CCI indicator is overbought : over 100
Type : Neutral
Timeframe : 1 hour
Williams %R indicator is overbought : over -20
Type : Neutral
Timeframe : 1 hour
Pivot points : price is over resistance 1
Type : Neutral
Timeframe : Weekly
Pivot points : price is over resistance 2
Type : Neutral
Timeframe : 1 hour
Central Patterns, the market scanner focusing on chart patterns, resistances and supports found these results:
Near horizontal resistance
Type : Bearish
Timeframe : 1 hour
Resistance of channel is broken
Type : Bullish
Timeframe : 1 hour
Central Candlesticks, the scanner specialised in Japanese candlesticks, detects this inversion signal that could impact the current short-term trend:
White gravestone / inverted hammer
Type : Neutral
Timeframe : 1 hour
| S3 | S2 | S1 | Price | |
|---|---|---|---|---|
| ProTrendLines | 151.95 | 152.59 | 153.39 | 153.94 |
| Change (%) | -1.29% | -0.88% | -0.36% | - |
| Change | -1.99 | -1.35 | -0.55 | - |
| Level | Major | Minor | Intermediate | - |
Attention could also be paid to pivot points to set price objectives:
| Pivot points | S3 | S2 | S1 | PP | R1 | R2 | R3 |
|---|---|---|---|---|---|---|---|
| Standard | 151.92 | 152.26 | 152.72 | 153.06 | 153.52 | 153.86 | 154.32 |
| Camarilla | 152.97 | 153.04 | 153.12 | 153.19 | 153.26 | 153.34 | 153.41 |
| Woodie | 151.99 | 152.29 | 152.79 | 153.09 | 153.59 | 153.89 | 154.39 |
| Fibonacci | 152.26 | 152.56 | 152.75 | 153.06 | 153.36 | 153.55 | 153.86 |
| Pivot points | S3 | S2 | S1 | PP | R1 | R2 | R3 |
|---|---|---|---|---|---|---|---|
| Standard | 150.19 | 150.87 | 152.03 | 152.71 | 153.87 | 154.55 | 155.71 |
| Camarilla | 152.68 | 152.85 | 153.02 | 153.19 | 153.36 | 153.53 | 153.70 |
| Woodie | 150.43 | 150.99 | 152.27 | 152.83 | 154.11 | 154.67 | 155.95 |
| Fibonacci | 150.87 | 151.57 | 152.01 | 152.71 | 153.41 | 153.85 | 154.55 |
| Pivot points | S3 | S2 | S1 | PP | R1 | R2 | R3 |
|---|---|---|---|---|---|---|---|
| Standard | 142.37 | 144.43 | 147.86 | 149.92 | 153.35 | 155.41 | 158.84 |
| Camarilla | 149.79 | 150.29 | 150.80 | 151.30 | 151.80 | 152.31 | 152.81 |
| Woodie | 143.07 | 144.77 | 148.56 | 150.26 | 154.05 | 155.75 | 159.54 |
| Fibonacci | 144.43 | 146.52 | 147.82 | 149.92 | 152.01 | 153.31 | 155.41 |
Numerical data
The following is the status of the technical indicators and moving averages at the time of publication of this technical analysis:
| RSI (14): | 74.57 | |
| MACD (12,26,9): | 0.2000 | |
| Directional Movement: | 19.04 | |
| AROON (14): | 71.43 | |
| DEMA (21): | 153.72 | |
| Parabolic SAR (0,02-0,02-0,2): | 153.30 | |
| Elder Ray (13): | 0.31 | |
| Super Trend (3,10): | 153.46 | |
| Zig ZAG (10): | 153.91 | |
| VORTEX (21): | 1.2100 | |
| Stochastique (14,3,5): | 97.81 | |
| TEMA (21): | 153.83 | |
| Williams %R (14): | -1.04 | |
| Chande Momentum Oscillator (20): | 0.74 | |
| Repulse (5,40,3): | 0.1500 | |
| ROCnROLL: | 1 | |
| TRIX (15,9): | 0.0100 | |
| Courbe Coppock: | 0.84 |
| MA7: | 152.64 | |
| MA20: | 151.81 | |
| MA50: | 150.36 | |
| MA100: | 147.97 | |
| MAexp7: | 153.75 | |
| MAexp20: | 153.49 | |
| MAexp50: | 153.22 | |
| MAexp100: | 152.85 | |
| Price / MA7: | +0.85% | |
| Price / MA20: | +1.40% | |
| Price / MA50: | +2.38% | |
| Price / MA100: | +4.03% | |
| Price / MAexp7: | +0.12% | |
| Price / MAexp20: | +0.29% | |
| Price / MAexp50: | +0.47% | |
| Price / MAexp100: | +0.71% |
News
The latest news and videos published on USD/JPY at the time of the analysis were as follows:
-
 USD/JPY Forecast April 15, 2024
-
USD/JPY Long Term Forecast and Technical Analysis for April 12, 2024, by Chris Lewis for FX Empire
-
USD/JPY Daily Forecast and Technical Analysis for April 12, 2024, by Chris Lewis for FX Empire
-
USD/JPY Forecast and Technical Analysis, April 11, 2024, by Chris Lewis #fxempire #trading #USDJPY
-
USD/JPY Forecast April 12, 2024
About author

Online


Add a comment
Comments
0 comments on the analysis USD/JPY - 1H