USD/JPY - 1H - Technical analysis published on 04/26/2024 (GMT)
- 101
- 0
- Timeframe : 1H
- - Analysis generated on
- Status : WITHOUT TARGET

Summary of the analysis

Additional analysis
Quotes
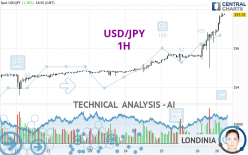
The USD/JPY price is 157.73 JPY. The price registered an increase of +1.36% on the session with the lowest point at 154.97 JPY and the highest point at 157.79 JPY. The deviation from the price is +1.78% for the low point and -0.04% for the high point.A study of price movements over other periods shows the following variations:
New HIGH record (5 years)
Type : Bullish
Timeframe : Weekly
New HIGH record (1 year)
Type : Bullish
Timeframe : Weekly
New HIGH record (1st january)
Type : Bullish
Timeframe : Weekly
New HIGH record (1 month)
Type : Bullish
Timeframe : Weekly
Technical
Technical analysis of this 1H chart of USD/JPY indicates that the overall trend is strongly bullish. The signals given by the moving averages are 92.86% bullish. This strong bullish trend is confirmed by the strong signals currently being given by short-term moving averages. The Central Indicators market scanner currently does not detect any result that concerns moving averages.
An assessment of technical indicators shows a strong bullish signal.
Caution: the Central Indicators scanner currently detects an excess:
RSI indicator is overbought : over 80
Type : Neutral
Timeframe : 1 hour
CCI indicator is overbought : over 100
Type : Neutral
Timeframe : 1 hour
Williams %R indicator is overbought : over -20
Type : Neutral
Timeframe : 1 hour
Pivot points : price is over resistance 3
Type : Neutral
Timeframe : 1 hour
Pivot points : price is over resistance 3
Type : Neutral
Timeframe : Weekly
The Central Patterns scanner, which studies chart patterns, resistances and supports, has identified these signals:
Near horizontal resistance
Type : Bearish
Timeframe : 1 hour
Resistance of channel is broken
Type : Bullish
Timeframe : 1 hour
The Central Candlesticks scanner, specialised in Japanese candlesticks, did not identify any signals.
| S3 | S2 | S1 | Price | |
|---|---|---|---|---|
| ProTrendLines | 154.70 | 155.31 | 155.75 | 157.73 |
| Change (%) | -1.92% | -1.53% | -1.26% | - |
| Change | -3.03 | -2.42 | -1.98 | - |
| Level | Intermediate | Minor | Intermediate | - |
To determine price objectives, it is also possible to use the pivot points. Here is the price position in relation to pivot points:
| Pivot points | S3 | S2 | S1 | PP | R1 | R2 | R3 |
|---|---|---|---|---|---|---|---|
| Standard | 154.81 | 155.03 | 155.32 | 155.54 | 155.83 | 156.05 | 156.34 |
| Camarilla | 155.48 | 155.53 | 155.57 | 155.62 | 155.67 | 155.71 | 155.76 |
| Woodie | 154.86 | 155.05 | 155.37 | 155.56 | 155.88 | 156.07 | 156.39 |
| Fibonacci | 155.03 | 155.22 | 155.34 | 155.54 | 155.73 | 155.85 | 156.05 |
| Pivot points | S3 | S2 | S1 | PP | R1 | R2 | R3 |
|---|---|---|---|---|---|---|---|
| Standard | 151.65 | 152.32 | 153.46 | 154.13 | 155.27 | 155.94 | 157.08 |
| Camarilla | 154.11 | 154.28 | 154.44 | 154.61 | 154.78 | 154.94 | 155.11 |
| Woodie | 151.90 | 152.44 | 153.71 | 154.25 | 155.52 | 156.06 | 157.33 |
| Fibonacci | 152.32 | 153.01 | 153.44 | 154.13 | 154.82 | 155.25 | 155.94 |
| Pivot points | S3 | S2 | S1 | PP | R1 | R2 | R3 |
|---|---|---|---|---|---|---|---|
| Standard | 142.37 | 144.43 | 147.86 | 149.92 | 153.35 | 155.41 | 158.84 |
| Camarilla | 149.79 | 150.29 | 150.80 | 151.30 | 151.80 | 152.31 | 152.81 |
| Woodie | 143.07 | 144.77 | 148.56 | 150.26 | 154.05 | 155.75 | 159.54 |
| Fibonacci | 144.43 | 146.52 | 147.82 | 149.92 | 152.01 | 153.31 | 155.41 |
Numerical data
The following is the status of the technical indicators and moving averages at the time of publication of this technical analysis:
| RSI (14): | 88.31 | |
| MACD (12,26,9): | 0.5300 | |
| Directional Movement: | 8.53 | |
| AROON (14): | 57.14 | |
| DEMA (21): | 157.45 | |
| Parabolic SAR (0,02-0,02-0,2): | 156.16 | |
| Elder Ray (13): | 0.65 | |
| Super Trend (3,10): | 156.78 | |
| Zig ZAG (10): | 157.73 | |
| VORTEX (21): | 1.3000 | |
| Stochastique (14,3,5): | 96.45 | |
| TEMA (21): | 157.72 | |
| Williams %R (14): | -2.13 | |
| Chande Momentum Oscillator (20): | 1.36 | |
| Repulse (5,40,3): | 0.2400 | |
| ROCnROLL: | 1 | |
| TRIX (15,9): | 0.0400 | |
| Courbe Coppock: | 1.89 |
| MA7: | 155.34 | |
| MA20: | 153.56 | |
| MA50: | 151.39 | |
| MA100: | 148.65 | |
| MAexp7: | 157.43 | |
| MAexp20: | 156.80 | |
| MAexp50: | 156.13 | |
| MAexp100: | 155.61 | |
| Price / MA7: | +1.54% | |
| Price / MA20: | +2.72% | |
| Price / MA50: | +4.19% | |
| Price / MA100: | +6.11% | |
| Price / MAexp7: | +0.19% | |
| Price / MAexp20: | +0.59% | |
| Price / MAexp50: | +1.02% | |
| Price / MAexp100: | +1.36% |
News
The last news published on USD/JPY at the time of the generation of this analysis was as follows:
-
 USD/JPY Forecast April 29, 2024
-
USD/JPY Long Term Forecast and Technical Analysis for April 26, 2024, by Chris Lewis for FX Empire
-
USD/JPY Daily Forecast and Technical Analysis for April 26, 2024, by Chris Lewis for FX Empire
-
USD/JPY Daily Forecast and Technical Analysis for April 25, 2024, by Chris Lewis for FX Empire
-
USD/JPY Forecast April 25, 2024
About author

Online


Add a comment
Comments
0 comments on the analysis USD/JPY - 1H