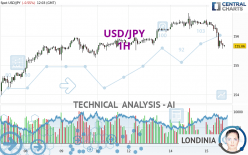
USD/JPY - 1H - Technical analysis published on 05/15/2024 (GMT)
- 67
- 0
Click here for a new analysis!
- Timeframe : 1H
- - Analysis generated on
- Status : TARGET REACHED

Summary of the analysis

Additional analysis
Quotes
USD/JPY rating 155.66 JPY. The price registered a decrease of -0.55% on the session and was traded between 155.57 JPY and 156.56 JPY over the period. The price is currently at +0.06% from its lowest and -0.57% from its highest.Here is a more detailed summary of the historical variations registered by USD/JPY:
Near a new HIGH record (5 years)
Type : Bullish
Timeframe : Weekly
Near a new HIGH record (1 year)
Type : Bullish
Timeframe : Weekly
Near a new HIGH record (1st january)
Type : Bullish
Timeframe : Weekly
Near a new HIGH record (1 month)
Type : Bullish
Timeframe : Weekly
Technical
Technical analysis of USD/JPY in 1H shows an overall bearish trend. The signals given by moving averages are 78.57% bearish. This bearish trend is reinforced by the strong signals currently being given by short-term moving averages. The Central Indicators scanner detects a bearish signal on moving averages that could impact this trend:
Moving Average bearish crossovers : MA20 & MA50
Type : Bearish
Timeframe : 1 hour
Technical indicators are strongly bearish, suggesting that the price decline is expected to continue.
But beware of excesses. The Central Indicators scanner currently detects this:
RSI indicator is oversold : under 30
Type : Neutral
Timeframe : 1 hour
CCI indicator is oversold : under -100
Type : Neutral
Timeframe : 1 hour
Williams %R indicator is oversold : under -80
Type : Neutral
Timeframe : 1 hour
Pivot points : price is under support 3
Type : Neutral
Timeframe : 1 hour
An analysis of the price chart with the Central Patterns scanner (detector of chart patterns and resistances and supports) shows several results that can have an impact on the price change:
Near horizontal support
Type : Bullish
Timeframe : 1 hour
Support of channel is broken
Type : Bearish
Timeframe : 1 hour
No result was found by the Central Candlesticks scanner on Japanese candlesticks.
| S3 | S2 | S1 | Price | R1 | R2 | R3 | |
|---|---|---|---|---|---|---|---|
| ProTrendLines | 152.77 | 154.00 | 154.70 | 155.66 | 155.96 | 156.78 | 158.33 |
| Change (%) | -1.86% | -1.07% | -0.62% | - | +0.19% | +0.72% | +1.72% |
| Change | -2.89 | -1.66 | -0.96 | - | +0.30 | +1.12 | +2.67 |
| Level | Minor | Intermediate | Minor | - | Major | Intermediate | Intermediate |
Attention could also be paid to pivot points to set price objectives:
| Pivot points | S3 | S2 | S1 | PP | R1 | R2 | R3 |
|---|---|---|---|---|---|---|---|
| Standard | 155.69 | 155.96 | 156.24 | 156.51 | 156.79 | 157.06 | 157.34 |
| Camarilla | 156.37 | 156.42 | 156.47 | 156.52 | 156.57 | 156.62 | 156.67 |
| Woodie | 155.70 | 155.96 | 156.25 | 156.51 | 156.80 | 157.06 | 157.35 |
| Fibonacci | 155.96 | 156.17 | 156.30 | 156.51 | 156.72 | 156.85 | 157.06 |
| Pivot points | S3 | S2 | S1 | PP | R1 | R2 | R3 |
|---|---|---|---|---|---|---|---|
| Standard | 150.57 | 151.68 | 153.73 | 154.84 | 156.89 | 158.00 | 160.05 |
| Camarilla | 154.90 | 155.19 | 155.48 | 155.77 | 156.06 | 156.35 | 156.64 |
| Woodie | 151.03 | 151.92 | 154.19 | 155.08 | 157.35 | 158.24 | 160.51 |
| Fibonacci | 151.68 | 152.89 | 153.64 | 154.84 | 156.05 | 156.80 | 158.00 |
| Pivot points | S3 | S2 | S1 | PP | R1 | R2 | R3 |
|---|---|---|---|---|---|---|---|
| Standard | 142.88 | 146.84 | 152.30 | 156.26 | 161.72 | 165.68 | 171.14 |
| Camarilla | 155.16 | 156.02 | 156.89 | 157.75 | 158.61 | 159.48 | 160.34 |
| Woodie | 143.62 | 147.22 | 153.04 | 156.64 | 162.46 | 166.06 | 171.88 |
| Fibonacci | 146.84 | 150.44 | 152.67 | 156.26 | 159.86 | 162.09 | 165.68 |
Numerical data
The following is the status of the technical indicators and moving averages at the time of publication of this technical analysis:
| RSI (14): | 29.77 | |
| MACD (12,26,9): | -0.1500 | |
| Directional Movement: | -27.43 | |
| AROON (14): | -57.14 | |
| DEMA (21): | 156.00 | |
| Parabolic SAR (0,02-0,02-0,2): | 156.34 | |
| Elder Ray (13): | -0.39 | |
| Super Trend (3,10): | 156.25 | |
| Zig ZAG (10): | 155.68 | |
| VORTEX (21): | 0.7900 | |
| Stochastique (14,3,5): | 17.85 | |
| TEMA (21): | 155.81 | |
| Williams %R (14): | -89.90 | |
| Chande Momentum Oscillator (20): | -0.84 | |
| Repulse (5,40,3): | -0.1300 | |
| ROCnROLL: | 2 | |
| TRIX (15,9): | 0.0000 | |
| Courbe Coppock: | 0.67 |
| MA7: | 155.67 | |
| MA20: | 155.40 | |
| MA50: | 152.74 | |
| MA100: | 150.21 | |
| MAexp7: | 155.89 | |
| MAexp20: | 156.15 | |
| MAexp50: | 156.17 | |
| MAexp100: | 155.98 | |
| Price / MA7: | -0.01% | |
| Price / MA20: | +0.17% | |
| Price / MA50: | +1.91% | |
| Price / MA100: | +3.63% | |
| Price / MAexp7: | -0.15% | |
| Price / MAexp20: | -0.31% | |
| Price / MAexp50: | -0.33% | |
| Price / MAexp100: | -0.21% |
News
The latest news and videos published on USD/JPY at the time of the analysis were as follows:
-
 USD/JPY Daily Forecast and Technical Analysis for May 14, 2024, by Chris Lewis for FX Empire
-
USD/JPY Forecast May 14, 2024
-
USD/JPY Daily Forecast and Technical Analysis for May 13, 2024, by Chris Lewis for FX Empire
-
USD/JPY Forecast May 13, 2024
-
USD/JPY Long Term Forecast and Technical Analysis for May 10, 2024, by Chris Lewis for FX Empire
About author

Online


Add a comment
Comments
0 comments on the analysis USD/JPY - 1H