USD/JPY - USD/JPY broken its downward wedge, will you trade? - 06/30/2015 (GMT)
- Who voted?
- 432
- 0
- Timeframe : 30 min.

USD/JPY Chart
Are you looking for opportunities in indices and forex?
DISCOVER LONDINIA OPPORTUNITIES...
DISCOVER LONDINIA OPPORTUNITIES...
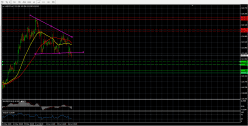
The USD/JPY is trading below its downward trend line on a 4 hour time frame. The price has broken its its downward wedge pattern and the projection of this pattern could the price well below the major support zone which is mentioned below. The pair is also trading below its 50 day shown in yellow colour and the 100 day shown in red colour moving averages and this confirms that the bears are in strong control of the price.
The RSI indicator and the MCAD indicator are trading in line with the price action and this reflects that the current trend may continue for a while whoever, at the same time caution should also be taken because both indicators are trading near oversold region.
The RSI indicator and the MCAD indicator are trading in line with the price action and this reflects that the current trend may continue for a while whoever, at the same time caution should also be taken because both indicators are trading near oversold region.
This member did not declare if he had a position on this financial instrument or a related financial instrument.
About author

Offline


Add a comment
Comments
0 comments on the analysis USD/JPY - 30 min.