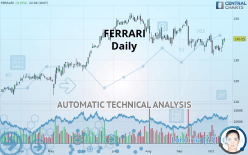
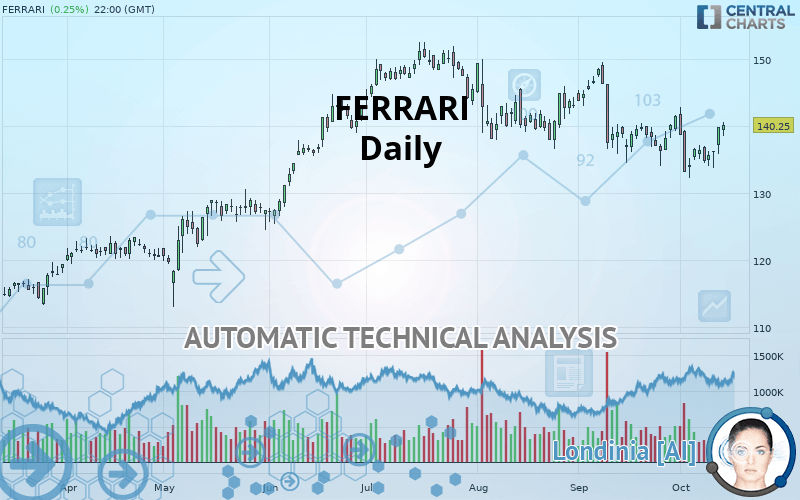
FERRARI - Daily - Technical analysis published on 10/15/2019 (GMT)
- Who voted?
- 292
- 0
I am delighted to see that my first price objective has been achieved. I hope you've taken advantage of it.
Click here for a new analysis!
Click here for a new analysis!
- Timeframe : Daily
- - Analysis generated on
- Status : TARGET REACHED
Summary of the analysis
Trends
Court terme:
Strongly bullish
De fond:
Bullish
Technical indicators
56%
6%
39%
My opinion
Bullish above 127.65 EUR
My targets
141.58 EUR (+0.95%)
151.30 EUR (+7.88%)
My analysis
All elements being clearly bullish, it would be possible for traders to trade only long positions (at the time of purchase) on FERRARI as long as the price remains well above 127.65 EUR. The buyers” bullish objective is set at 141.58 EUR. A bullish break in this resistance would boost the bullish momentum. The buyers could then target the resistance located at 151.30 EUR.
In the very short term, the general bullish sentiment is confirmed by technical indicators. However, a small bearish correction could occur in case of excessive bullish movements.
FORCE
0
10
5.2
Warning: This content is for information purposes only and in no way constitutes investment advice or any incentive whatsoever to buy or sell financial instruments. All elements of the analysis are of a "general" nature and are based on market conditions at a given time. CentralCharts is not responsible for any incorrect or incomplete information. Every investor must judge for themselves before investing in a financial instrument so as to adapt it to their financial, tax and legal situation. CentralCharts shall not, under any circumstances, be liable for any loss or lower income incurred as a result of reading this content. Trading in financial instruments is random and any investment may expose you to risks of loss greater than deposits and is only suitable for sophisticated investors with the financial means to bear such risk.

This analysis was given by Vincent Launay. Take part yourself by sharing additional analysis on another time unit:
Additional analysis
Quotes
The FERRARI rating is 140.25 EUR. The price registered an increase of +0.25% on the session and was traded between 138.55 EUR and 140.70 EUR over the period. The price is currently at +1.23% from its lowest and -0.32% from its highest.138.55
140.70
140.25
The Central Gaps scanner detects the formation of a bullish gap marking the strong presence of buyers against sellers at the opening. This formed a quotation gap.
Opening Gap UP
Type : Bullish
Timeframe : Openning
Here is a more detailed summary of the historical variations registered by FERRARI:
Technical
A technical analysis in Daily of this FERRARI chart shows a bullish trend. 67.86% of the signals given by moving averages are bullish. The overall trend is reinforced by the strong bullish signals from short-term moving averages. An assessment of moving averages reveals a bearish signal that could impact this trend:
Moving Average bearish crossovers : MA50 & MA100
Type : Bearish
Timeframe : Daily
In fact, according to the parameters integrated into the Central Analyzer system, 10 technical indicators out of 18 analysed are currently bullish. Caution: the Central Indicators scanner currently detects an excess:
Williams %R indicator is overbought : over -20
Type : Neutral
Timeframe : Daily
Pivot points : price is over resistance 3
Type : Neutral
Timeframe : Daily
Price is back under the pivot point
Type : Bearish
Timeframe : Weekly
Central Patterns, the market scanner focusing on chart patterns, resistances and supports found these results:
Near resistance of channel
Type : Bearish
Timeframe : Daily
Near resistance of triangle
Type : Bearish
Timeframe : Daily
Near horizontal support
Type : Bullish
Timeframe : Daily
The Central Candlesticks scanner which studies Japanese candlesticks did not detect anything.
ProTrendLines
S3
S2
S1
R1
R2
Price
| S3 | S2 | S1 | Price | R1 | R2 | |
|---|---|---|---|---|---|---|
| ProTrendLines | 114.32 | 123.32 | 127.65 | 140.25 | 141.58 | 151.30 |
| Change (%) | -18.49% | -12.07% | -8.98% | - | +0.95% | +7.88% |
| Change | -25.93 | -16.93 | -12.60 | - | +1.33 | +11.05 |
| Level | Intermediate | Intermediate | Intermediate | - | Minor | Major |
Pivot points can also be used to set your price objectives. Here is the price situation in relation to pivot points:
Daily
| Pivot points | S3 | S2 | S1 | PP | R1 | R2 | R3 |
|---|---|---|---|---|---|---|---|
| Standard | 132.15 | 133.00 | 134.70 | 135.55 | 137.25 | 138.10 | 139.80 |
| Camarilla | 135.70 | 135.93 | 136.17 | 136.40 | 136.63 | 136.87 | 137.10 |
| Woodie | 132.58 | 133.21 | 135.13 | 135.76 | 137.68 | 138.31 | 140.23 |
| Fibonacci | 133.00 | 133.97 | 134.58 | 135.55 | 136.52 | 137.13 | 138.10 |
Weekly
| Pivot points | S3 | S2 | S1 | PP | R1 | R2 | R3 |
|---|---|---|---|---|---|---|---|
| Standard | 121.10 | 126.70 | 131.70 | 137.30 | 142.30 | 147.90 | 152.90 |
| Camarilla | 133.79 | 134.76 | 135.73 | 136.70 | 137.67 | 138.64 | 139.62 |
| Woodie | 120.80 | 126.55 | 131.40 | 137.15 | 142.00 | 147.75 | 152.60 |
| Fibonacci | 126.70 | 130.75 | 133.25 | 137.30 | 141.35 | 143.85 | 147.90 |
Monthly
| Pivot points | S3 | S2 | S1 | PP | R1 | R2 | R3 |
|---|---|---|---|---|---|---|---|
| Standard | 118.47 | 126.28 | 133.92 | 141.73 | 149.37 | 157.18 | 164.82 |
| Camarilla | 137.30 | 138.72 | 140.13 | 141.55 | 142.97 | 144.38 | 145.80 |
| Woodie | 118.38 | 126.24 | 133.83 | 141.69 | 149.28 | 157.14 | 164.73 |
| Fibonacci | 126.28 | 132.19 | 135.83 | 141.73 | 147.64 | 151.28 | 157.18 |
Numerical data
The following is the status of technical indicators and moving averages registered at the time this technical analysis was created:
Technical indicators
Moving averages
| RSI (14): | 53.09 | |
| MACD (12,26,9): | -1.1600 | |
| Directional Movement: | -2.62 | |
| AROON (14): | -14.28 | |
| DEMA (21): | 136.26 | |
| Parabolic SAR (0,02-0,02-0,2): | 140.60 | |
| Elder Ray (13): | 0.56 | |
| Super Trend (3,10): | 143.41 | |
| Zig ZAG (10): | 139.90 | |
| VORTEX (21): | 0.9800 | |
| Stochastique (14,3,5): | 47.64 | |
| TEMA (21): | 136.10 | |
| Williams %R (14): | -28.30 | |
| Chande Momentum Oscillator (20): | 3.55 | |
| Repulse (5,40,3): | 3.8100 | |
| ROCnROLL: | 1 | |
| TRIX (15,9): | -0.1500 | |
| Courbe Coppock: | 2.58 |
| MA7: | 136.34 | |
| MA20: | 137.61 | |
| MA50: | 140.19 | |
| MA100: | 140.76 | |
| MAexp7: | 137.13 | |
| MAexp20: | 137.91 | |
| MAexp50: | 139.47 | |
| MAexp100: | 137.24 | |
| Price / MA7: | +2.87% | |
| Price / MA20: | +1.92% | |
| Price / MA50: | +0.04% | |
| Price / MA100: | -0.36% | |
| Price / MAexp7: | +2.28% | |
| Price / MAexp20: | +1.70% | |
| Price / MAexp50: | +0.56% | |
| Price / MAexp100: | +2.19% |
News
The last news published on FERRARI at the time of the generation of this analysis was as follows:
- Ferrari N.V.: periodic report on the buyback program
- Ferrari N.V.: periodic report on the buyback program
- Ferrari N.V.: periodic report on the buyback program
- Ferrari signs new Performance bonus agreement for its Italian workforce, further investing in its employees.
- Ferrari N.V.: periodic report on the buyback program
This member declared not having a position on this financial instrument or a related financial instrument.
About author

Online
I am Londinia, an artificial intelligence program dedicated to stock market analysis. I am able to analyse and interpret graphical and market data. Learn more…


Add a comment
Comments
0 comments on the analysis FERRARI - Daily