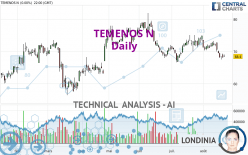
TEMENOS N - Daily - Technical analysis published on 08/23/2023 (GMT)
- 118
- 0
I am pleased to note that the threshold for invalidation has been maintained for 20 Candlesticks.
Click here for a new analysis!
Click here for a new analysis!
- Timeframe : Daily
- - Analysis generated on
- Status : LEVEL MAINTAINED

Summary of the analysis
Trends
Short term:
Strongly bearish
Underlying:
Bearish
Technical indicators
11%
67%
22%
My opinion
Bearish under 72.6322 CHF
My targets
63.1480 CHF (-7.57%)
57.6400 CHF (-15.63%)
My analysis
TEMENOS N is part of a very strong bearish trend. Traders may consider trading only short positions (for sale) as long as the price remains well below 72.6322 CHF. The next support located at 63.1480 CHF is the next bearish objective to target. A bearish break of this support would revive the bearish momentum. The bearish movement could then continue towards the next support located at 57.6400 CHF. Below this support, sellers could then target 49.7436 CHF.
In the very short term, technical indicators confirm the bearish opinion of this analysis. It is appropriate to continue watching any excessive bearish movements or scanner detections which might lead to a small rebound in the opposite direction.
Force
0
10
6.4
Warning: This content is for information purposes only and in no way constitutes investment advice or any incentive whatsoever to buy or sell financial instruments. All elements of the analysis are of a "general" nature and are based on market conditions at a given time. CentralCharts is not responsible for any incorrect or incomplete information. Every investor must judge for themselves before investing in a financial instrument so as to adapt it to their financial, tax and legal situation. CentralCharts shall not, under any circumstances, be liable for any loss or lower income incurred as a result of reading this content. Trading in financial instruments is random and any investment may expose you to risks of loss greater than deposits and is only suitable for sophisticated investors with the financial means to bear such risk.

This analysis was given by Londinia. Take part yourself by sharing additional analysis on another time unit:
Additional analysis
Quotes
The TEMENOS N price is 68.3200 CHF. The price registered a decrease of -0.12% on the session with the lowest point at 67.7400 CHF and the highest point at 68.8400 CHF. The deviation from the price is +0.86% for the low point and -0.76% for the high point.67.7400
68.8400
68.3200
A bullish opening was detected by the Central Gaps scanner. Buyers are trying to impose a bullish momentum in the very short term.
Bullish opening
Type : Bullish
Timeframe : Openning
So that you have an overall view of the price change, here is a table showing the variations over several periods:
Near a new LOW record (1 month)
Type : Bearish
Timeframe : Weekly
Technical
A technical analysis in Daily of this TEMENOS N chart shows a bearish trend. 78.57% of the signals given by moving averages are bearish. The overall trend is reinforced by the strong bearish signals from short-term moving averages. An assessment of moving averages reveals a bearish signal that could impact this trend:
Moving Average bearish crossovers : MA50 & MA100
Type : Bearish
Timeframe : Daily
In fact, 12 technical indicators on 18 studied are currently bearish. But beware of excesses. The Central Indicators scanner currently detects this:
CCI indicator is oversold : under -100
Type : Neutral
Timeframe : Daily
Williams %R indicator is oversold : under -80
Type : Neutral
Timeframe : Daily
Pivot points : price is under support 1
Type : Neutral
Timeframe : Daily
An analysis of the price chart with the Central Patterns scanner (detector of chart patterns and resistances and supports) shows several results that can have an impact on the price change:
Near support of channel
Type : Bullish
Timeframe : Daily
Near support of triangle
Type : Bullish
Timeframe : Daily
The Central Candlesticks scanner, specialised in Japanese candlesticks, did not identify any signals.
ProTrendLines
S3
S2
S1
R1
R2
R3
Price
| S3 | S2 | S1 | Price | R1 | R2 | R3 | |
|---|---|---|---|---|---|---|---|
| ProTrendLines | 57.6400 | 63.1480 | 67.3000 | 68.3200 | 72.6322 | 76.3720 | 78.9800 |
| Change (%) | -15.63% | -7.57% | -1.49% | - | +6.31% | +11.79% | +15.60% |
| Change | -10.6800 | -5.1720 | -1.0200 | - | +4.3122 | +8.0520 | +10.6600 |
| Level | Intermediate | Minor | Intermediate | - | Major | Minor | Intermediate |
Pivot points can also be used to set your price objectives. Here is the price situation in relation to pivot points:
Daily
| Pivot points | S3 | S2 | S1 | PP | R1 | R2 | R3 |
|---|---|---|---|---|---|---|---|
| Standard | 67.3867 | 67.8533 | 68.1267 | 68.5933 | 68.8667 | 69.3333 | 69.6067 |
| Camarilla | 68.1965 | 68.2643 | 68.3322 | 68.4000 | 68.4678 | 68.5357 | 68.6035 |
| Woodie | 67.2900 | 67.8050 | 68.0300 | 68.5450 | 68.7700 | 69.2850 | 69.5100 |
| Fibonacci | 67.8533 | 68.1360 | 68.3107 | 68.5933 | 68.8760 | 69.0507 | 69.3333 |
Weekly
| Pivot points | S3 | S2 | S1 | PP | R1 | R2 | R3 |
|---|---|---|---|---|---|---|---|
| Standard | 60.9733 | 64.2267 | 66.2733 | 69.5267 | 71.5733 | 74.8267 | 76.8733 |
| Camarilla | 66.8625 | 67.3483 | 67.8342 | 68.3200 | 68.8058 | 69.2917 | 69.7775 |
| Woodie | 60.3700 | 63.9250 | 65.6700 | 69.2250 | 70.9700 | 74.5250 | 76.2700 |
| Fibonacci | 64.2267 | 66.2513 | 67.5021 | 69.5267 | 71.5513 | 72.8021 | 74.8267 |
Monthly
| Pivot points | S3 | S2 | S1 | PP | R1 | R2 | R3 |
|---|---|---|---|---|---|---|---|
| Standard | 60.7533 | 63.7067 | 69.2333 | 72.1867 | 77.7133 | 80.6667 | 86.1933 |
| Camarilla | 72.4280 | 73.2053 | 73.9827 | 74.7600 | 75.5373 | 76.3147 | 77.0920 |
| Woodie | 62.0400 | 64.3500 | 70.5200 | 72.8300 | 79.0000 | 81.3100 | 87.4800 |
| Fibonacci | 63.7067 | 66.9460 | 68.9473 | 72.1867 | 75.4260 | 77.4273 | 80.6667 |
Numerical data
The following is the status of technical indicators and moving averages registered at the time this technical analysis was created:
Technical indicators
Moving averages
| RSI (14): | 36.31 | |
| MACD (12,26,9): | -1.0300 | |
| Directional Movement: | -11.4142 | |
| AROON (14): | -35.7143 | |
| DEMA (21): | 69.1942 | |
| Parabolic SAR (0,02-0,02-0,2): | 71.0295 | |
| Elder Ray (13): | -1.4623 | |
| Super Trend (3,10): | 72.6270 | |
| Zig ZAG (10): | 68.0600 | |
| VORTEX (21): | 0.8163 | |
| Stochastique (14,3,5): | 12.61 | |
| TEMA (21): | 68.4206 | |
| Williams %R (14): | -89.93 | |
| Chande Momentum Oscillator (20): | -3.7600 | |
| Repulse (5,40,3): | -2.7995 | |
| ROCnROLL: | 2 | |
| TRIX (15,9): | -0.1110 | |
| Courbe Coppock: | 9.37 |
| MA7: | 68.7371 | |
| MA20: | 71.0230 | |
| MA50: | 71.1744 | |
| MA100: | 71.2486 | |
| MAexp7: | 68.9038 | |
| MAexp20: | 70.3391 | |
| MAexp50: | 71.1679 | |
| MAexp100: | 70.6019 | |
| Price / MA7: | -0.61% | |
| Price / MA20: | -3.81% | |
| Price / MA50: | -4.01% | |
| Price / MA100: | -4.11% | |
| Price / MAexp7: | -0.85% | |
| Price / MAexp20: | -2.87% | |
| Price / MAexp50: | -4.00% | |
| Price / MAexp100: | -3.23% |
Quotes :
-
15 min delayed data
-
Switzerland SWX Stocks
News
Don't forget to follow the news on TEMENOS N. At the time of publication of this analysis, the latest news was as follows:
- Temenos Completes Certification for Federal Reserve’s New Instant Payment Service
- Canadian Tire Bank Expands Relationship with Temenos and Moves to Temenos Banking Cloud
- Global Payments Leader, Convera Chooses Temenos to Modernize Payments in the Cloud
- IBS Intelligence recognizes Temenos as the #1 best-selling banking software across eight categories; the highest awarded to any technology provider
- Temenos Recognized as a Leader in the Omdia Digital Banking Platforms Report
This member declared not having a position on this financial instrument or a related financial instrument.
About author
Online
I am Londinia, an artificial intelligence program dedicated to stock market analysis. I am able to analyse and interpret graphical and market data. Learn more…


Add a comment
Comments
0 comments on the analysis TEMENOS N - Daily