SWISS STEEL HOLDING AG - Daily - Technical analysis published on 04/29/2024 (GMT)
- 61
- 0
Click here for a new analysis!
- Timeframe : Daily
- - Analysis generated on
- Status : INVALID
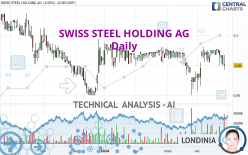

Summary of the analysis

Additional analysis
Quotes
SWISS STEEL HOLDING AG rating 0.0869 CHF. The price has increased by +8.63% since the last closing with the lowest point at 0.0862 CHF and the highest point at 0.0869 CHF. The deviation from the price is +0.81% for the low point and 0% for the high point.The Central Gaps scanner detects a bullish opening marking the presence of buyers ahead of sellers at the opening but not sufficiently marked to allow the price to register a quotation gap.
Bullish opening
Type : Bullish
Timeframe : Openning
So that you have an overall view of the price change, here is a table showing the variations over several periods:
Abnormal volumes
Timeframe : 5 days
Abnormal volumes
Timeframe : 20 days
Technical
Technical analysis of this Daily chart of SWISS STEEL HOLDING AG indicates that the overall trend is bullish. 64.29% of the signals given by moving averages are bullish. This bullish trend is supported by the strong bullish signals given by short-term moving averages. An assessment of moving averages reveals several bullish signals that could impact this trend:
Moving Average bullish crossovers : MA20 & MA50
Type : Bullish
Timeframe : Daily
Bullish price crossover with Moving Average 20
Type : Bullish
Timeframe : Daily
Bullish price crossover with Moving Average 50
Type : Bullish
Timeframe : Daily
Bullish price crossover with Moving Average 100
Type : Bullish
Timeframe : Daily
Bullish price crossover with adaptative moving average 20
Type : Bullish
Timeframe : Daily
Bullish price crossover with adaptative moving average 50
Type : Bullish
Timeframe : Daily
Bullish price crossover with adaptative moving average 100
Type : Bullish
Timeframe : Daily
Technical indicators are slightly bullish. There is therefore considerable uncertainty about the continuation of the increase.
Central Indicators, the detector scanner for these technical indicators has recently detected several signals:
Pivot points : price is over resistance 1
Type : Neutral
Timeframe : Daily
Pivot points : price is under support 3
Type : Neutral
Timeframe : Weekly
RSI indicator is back over 50
Type : Bullish
Timeframe : Daily
Ichimoku : price is over the cloud
Type : Bullish
Timeframe : Daily
Momentum indicator is back over 0
Type : Bullish
Timeframe : Daily
Williams %R indicator is back over -50
Type : Bullish
Timeframe : Daily
Central Patterns, the scanner specializing in chart patterns, did not identify any signals.
No result was found by the Central Candlesticks scanner on Japanese candlesticks.
| S3 | S2 | S1 | Price | R1 | R2 | R3 | |
|---|---|---|---|---|---|---|---|
| ProTrendLines | 0.0600 | 0.0695 | 0.0790 | 0.0869 | 0.0915 | 0.1098 | 0.1212 |
| Change (%) | -30.96% | -20.02% | -9.09% | - | +5.29% | +26.35% | +39.47% |
| Change | -0.0269 | -0.0174 | -0.0079 | - | +0.0046 | +0.0229 | +0.0343 |
| Level | Major | Intermediate | Minor | - | Intermediate | Minor | Minor |
To determine price objectives, it is also possible to use the pivot points. Here is the price position in relation to pivot points:
| Pivot points | S3 | S2 | S1 | PP | R1 | R2 | R3 |
|---|---|---|---|---|---|---|---|
| Standard | 0.0658 | 0.0714 | 0.0757 | 0.0813 | 0.0856 | 0.0912 | 0.0955 |
| Camarilla | 0.0773 | 0.0782 | 0.0791 | 0.0800 | 0.0809 | 0.0818 | 0.0827 |
| Woodie | 0.0652 | 0.0711 | 0.0751 | 0.0810 | 0.0850 | 0.0909 | 0.0949 |
| Fibonacci | 0.0714 | 0.0752 | 0.0775 | 0.0813 | 0.0851 | 0.0874 | 0.0912 |
| Pivot points | S3 | S2 | S1 | PP | R1 | R2 | R3 |
|---|---|---|---|---|---|---|---|
| Standard | 0.0605 | 0.0687 | 0.0744 | 0.0826 | 0.0883 | 0.0965 | 0.1022 |
| Camarilla | 0.0762 | 0.0775 | 0.0787 | 0.0800 | 0.0813 | 0.0826 | 0.0838 |
| Woodie | 0.0592 | 0.0681 | 0.0731 | 0.0820 | 0.0870 | 0.0959 | 0.1009 |
| Fibonacci | 0.0687 | 0.0740 | 0.0773 | 0.0826 | 0.0879 | 0.0912 | 0.0965 |
| Pivot points | S3 | S2 | S1 | PP | R1 | R2 | R3 |
|---|---|---|---|---|---|---|---|
| Standard | 0.0266 | 0.0434 | 0.0575 | 0.0743 | 0.0884 | 0.1052 | 0.1193 |
| Camarilla | 0.0632 | 0.0660 | 0.0689 | 0.0717 | 0.0745 | 0.0774 | 0.0802 |
| Woodie | 0.0254 | 0.0427 | 0.0563 | 0.0736 | 0.0872 | 0.1045 | 0.1181 |
| Fibonacci | 0.0434 | 0.0552 | 0.0625 | 0.0743 | 0.0861 | 0.0934 | 0.1052 |
Numerical data
The following are the details of the technical indicators and moving averages that were collected to generate this technical analysis:
| RSI (14): | 51.54 | |
| MACD (12,26,9): | 0.0008 | |
| Directional Movement: | -11.3935 | |
| AROON (14): | -35.7142 | |
| DEMA (21): | 0.0866 | |
| Parabolic SAR (0,02-0,02-0,2): | 0.0921 | |
| Elder Ray (13): | 0.0006 | |
| Super Trend (3,10): | 0.0733 | |
| Zig ZAG (10): | 0.0869 | |
| VORTEX (21): | 1.0267 | |
| Stochastique (14,3,5): | 48.99 | |
| TEMA (21): | 0.0874 | |
| Williams %R (14): | -29.29 | |
| Chande Momentum Oscillator (20): | 0.0029 | |
| Repulse (5,40,3): | 4.6413 | |
| ROCnROLL: | 1 | |
| TRIX (15,9): | 0.1976 | |
| Courbe Coppock: | 11.33 |
| MA7: | 0.0866 | |
| MA20: | 0.0855 | |
| MA50: | 0.0849 | |
| MA100: | 0.0835 | |
| MAexp7: | 0.0860 | |
| MAexp20: | 0.0855 | |
| MAexp50: | 0.0850 | |
| MAexp100: | 0.0874 | |
| Price / MA7: | +0.35% | |
| Price / MA20: | +1.64% | |
| Price / MA50: | +2.36% | |
| Price / MA100: | +4.07% | |
| Price / MAexp7: | +1.05% | |
| Price / MAexp20: | +1.64% | |
| Price / MAexp50: | +2.24% | |
| Price / MAexp100: | -0.57% |
News
Don't forget to follow the news on SWISS STEEL HOLDING AG. At the time of publication of this analysis, the latest news was as follows:
- Swiss Steel Holding AG announces envisaged changes to the Board of Directors and a planned reverse stock split
- Swiss Steel Holding AG successfully completes share offering in the context of its capital increase with gross proceeds of EUR 300 million
- Swiss Steel Holding AG announces the results of its rights offering
- Swiss Steel Holding AG publishes rights offering prospectus and announces the launch of its rights offering
- Shareholders approve all proposals at Extraordinary General Meeting
About author
Online


Add a comment
Comments
0 comments on the analysis SWISS STEEL HOLDING AG - Daily