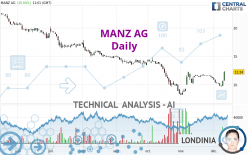
MANZ AG - Daily - Technical analysis published on 12/12/2023 (GMT)
- 75
- 0
Click here for a new analysis!
- Timeframe : Daily
- - Analysis generated on
- Status : TARGET REACHED

Summary of the analysis

Additional analysis
Quotes
The MANZ AG price is 12.24 EUR. On the day, this instrument gained +15.04% with the lowest point at 10.70 EUR and the highest point at 12.40 EUR. The deviation from the price is +14.39% for the low point and -1.29% for the high point.The Central Gaps scanner detects a bullish opening. A small advantage for buyers in the very short term.
Bullish opening
Type : Bullish
Timeframe : Openning
So that you have an overall view of the price change, here is a table showing the variations over several periods:
New HIGH record (1 month)
Type : Bullish
Timeframe : Weekly
The Central Volumes scanner notes the presence of abnormal volumes:
Abnormal volumes
Timeframe : 50 days
Technical
Technical analysis of this Daily chart of MANZ AG indicates that the overall trend is slightly bearish. Only 57.14% of the signals given by moving averages are bearish. This slightly bearish trend could quickly be reversed due to the strong bullish signals currently being given by short-term moving averages. The Central Indicators market scanner is currently detecting several bullish signals that could impact this trend:
Bullish price crossover with Moving Average 20
Type : Bullish
Timeframe : Daily
Bullish price crossover with Moving Average 50
Type : Bullish
Timeframe : Daily
Bullish price crossover with adaptative moving average 100
Type : Bullish
Timeframe : Daily
In fact, only 9 technical indicators out of 18 studied are currently positioned bullish. But beware of excesses. The Central Indicators scanner currently detects this:
Williams %R indicator is overbought : over -20
Type : Neutral
Timeframe : Daily
Pivot points : price is over resistance 3
Type : Neutral
Timeframe : Daily
Pivot points : price is over resistance 3
Type : Neutral
Timeframe : Weekly
RSI indicator is back over 50
Type : Bullish
Timeframe : Daily
MACD crosses UP its Moving Average
Type : Bullish
Timeframe : Daily
Parabolic SAR indicator bullish reversal
Type : Bullish
Timeframe : Daily
Aroon indicator bullish trend
Type : Bullish
Timeframe : Daily
Ichimoku : price is over the cloud
Type : Bullish
Timeframe : Daily
SuperTrend indicator bullish reversal
Type : Bullish
Timeframe : Daily
Momentum indicator is back over 0
Type : Bullish
Timeframe : Daily
Central Patterns, the market scanner focusing on chart patterns, resistances and supports found these results:
Horizontal resistance is broken
Type : Bullish
Timeframe : Daily
Resistance of channel is broken
Type : Bullish
Timeframe : Daily
Central Candlesticks, the scanner specialised in Japanese candlesticks, detects these bullish signals that could support the hypothesis of a small rebound in the very short term:
White line without lower shadow
Type : Bullish
Timeframe : Daily
Long white line
Type : Bullish
Timeframe : Daily
| S3 | S2 | S1 | Price | R1 | R2 | R3 | |
|---|---|---|---|---|---|---|---|
| ProTrendLines | 8.16 | 10.28 | 11.75 | 12.24 | 16.59 | 21.84 | 25.70 |
| Change (%) | -33.33% | -16.01% | -4.00% | - | +35.54% | +78.43% | +109.97% |
| Change | -4.08 | -1.96 | -0.49 | - | +4.35 | +9.60 | +13.46 |
| Level | Major | Minor | Minor | - | Minor | Major | Major |
Pivot points can also be used to set your price objectives. Here is the price situation in relation to pivot points:
| Pivot points | S3 | S2 | S1 | PP | R1 | R2 | R3 |
|---|---|---|---|---|---|---|---|
| Standard | 9.09 | 9.43 | 10.03 | 10.37 | 10.97 | 11.31 | 11.91 |
| Camarilla | 10.38 | 10.47 | 10.55 | 10.64 | 10.73 | 10.81 | 10.90 |
| Woodie | 9.23 | 9.50 | 10.17 | 10.44 | 11.11 | 11.38 | 12.05 |
| Fibonacci | 9.43 | 9.79 | 10.01 | 10.37 | 10.73 | 10.95 | 11.31 |
| Pivot points | S3 | S2 | S1 | PP | R1 | R2 | R3 |
|---|---|---|---|---|---|---|---|
| Standard | 7.97 | 8.78 | 9.23 | 10.04 | 10.49 | 11.30 | 11.75 |
| Camarilla | 9.34 | 9.46 | 9.58 | 9.69 | 9.81 | 9.92 | 10.04 |
| Woodie | 7.80 | 8.69 | 9.06 | 9.95 | 10.32 | 11.21 | 11.58 |
| Fibonacci | 8.78 | 9.26 | 9.56 | 10.04 | 10.52 | 10.82 | 11.30 |
| Pivot points | S3 | S2 | S1 | PP | R1 | R2 | R3 |
|---|---|---|---|---|---|---|---|
| Standard | 4.61 | 6.37 | 8.75 | 10.51 | 12.89 | 14.65 | 17.03 |
| Camarilla | 10.00 | 10.38 | 10.76 | 11.14 | 11.52 | 11.90 | 12.28 |
| Woodie | 4.93 | 6.53 | 9.07 | 10.67 | 13.21 | 14.81 | 17.35 |
| Fibonacci | 6.37 | 7.95 | 8.93 | 10.51 | 12.09 | 13.07 | 14.65 |
Numerical data
The following are the details of the technical indicators and moving averages that were collected to generate this technical analysis:
| RSI (14): | 61.25 | |
| MACD (12,26,9): | -0.1400 | |
| Directional Movement: | 16.85 | |
| AROON (14): | 14.29 | |
| DEMA (21): | 10.70 | |
| Parabolic SAR (0,02-0,02-0,2): | 9.58 | |
| Elder Ray (13): | 0.70 | |
| Super Trend (3,10): | 9.85 | |
| Zig ZAG (10): | 12.24 | |
| VORTEX (21): | 0.9600 | |
| Stochastique (14,3,5): | 49.17 | |
| TEMA (21): | 10.86 | |
| Williams %R (14): | -5.67 | |
| Chande Momentum Oscillator (20): | 0.60 | |
| Repulse (5,40,3): | 20.0800 | |
| ROCnROLL: | 1 | |
| TRIX (15,9): | -0.1600 | |
| Courbe Coppock: | 15.73 |
| MA7: | 10.48 | |
| MA20: | 11.13 | |
| MA50: | 11.20 | |
| MA100: | 13.07 | |
| MAexp7: | 10.84 | |
| MAexp20: | 10.90 | |
| MAexp50: | 11.54 | |
| MAexp100: | 13.19 | |
| Price / MA7: | +16.79% | |
| Price / MA20: | +9.97% | |
| Price / MA50: | +9.29% | |
| Price / MA100: | -6.35% | |
| Price / MAexp7: | +12.92% | |
| Price / MAexp20: | +12.29% | |
| Price / MAexp50: | +6.07% | |
| Price / MAexp100: | -7.20% |
News
The latest news and videos published on MANZ AG at the time of the analysis were as follows:
- EQS-News: Manz AG with significant jump in earnings in the first nine months of 2023
- EQS-News: Manz AG: New orders underline growth opportunities in the e-mobility and electronics industries
- EQS-News: Manz AG with positive revenue and earnings development in the first half of 2023
- EQS-News: Manz AG reports to Annual General Meeting on fiscal year 2022 and provides outlook for 2023
- Manz AG wins renowned new customer from the automotive industry and receives order for high-volume assembly line for inverters
About author
Online


Add a comment
Comments
0 comments on the analysis MANZ AG - Daily