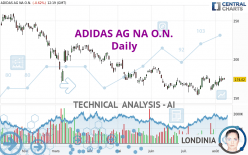
ADIDAS AG NA O.N. - Daily - Technical analysis published on 08/09/2022 (GMT)
- 160
- 0
Oops, I was wrong about that analysis. My threshold for invalidation has been broken.
Click here for a new analysis!
Click here for a new analysis!
- Timeframe : Daily
- - Analysis generated on
- Status : INVALID

Summary of the analysis
Trends
Short term:
Strongly bullish
Underlying:
Slightly bearish
Technical indicators
56%
11%
33%
My opinion
Bullish above 163.76 EUR
My targets
188.34 EUR (+8.23%)
210.91 EUR (+21.20%)
My analysis
The current short-term bullish trend is expected to quickly reset the neutral or bullish trend. To avoid contradicting the short term, it would be possible to favour long positions (at the time of purchase) for ADIDAS AG NA O.N. as long as the price remains well above 163.76 EUR. The buyers' bullish objective is set at 188.34 EUR. A bullish break in this resistance would boost the bullish momentum. The buyers could then target the resistance located at 210.91 EUR. If there is any crossing, the next objective would be the resistance located at 247.92 EUR. As the basic trend is not clearly displayed, attention should be paid to the price reaction to the resistance at 188.34 EUR. On this resistance, against the trend traders who would like to go short on ADIDAS AG NA O.N. with a bearish signal from their trading strategy, should not hesitate to act.
In the very short term, the general bullish sentiment is confirmed by technical indicators. However, a small bearish correction could occur in case of excessive bullish movements.
Force
0
10
1.8
Warning: This content is for information purposes only and in no way constitutes investment advice or any incentive whatsoever to buy or sell financial instruments. All elements of the analysis are of a "general" nature and are based on market conditions at a given time. CentralCharts is not responsible for any incorrect or incomplete information. Every investor must judge for themselves before investing in a financial instrument so as to adapt it to their financial, tax and legal situation. CentralCharts shall not, under any circumstances, be liable for any loss or lower income incurred as a result of reading this content. Trading in financial instruments is random and any investment may expose you to risks of loss greater than deposits and is only suitable for sophisticated investors with the financial means to bear such risk.

This analysis was given by Londinia. Take part yourself by sharing additional analysis on another time unit:
Additional analysis
Quotes
The ADIDAS AG NA O.N. rating is 174.02 EUR. On the day, this instrument lost -0.62% with the lowest point at 173.52 EUR and the highest point at 176.20 EUR. The deviation from the price is +0.29% for the low point and -1.24% for the high point.173.52
176.20
174.02
The Central Gaps scanner detects the formation of a bullish gap marking the strong presence of buyers against sellers at the opening. This formed a quotation gap.
Opening Gap UP
Type : Bullish
Timeframe : Openning
Here is a more detailed summary of the historical variations registered by ADIDAS AG NA O.N.:
Near a new HIGH record (1 month)
Type : Bullish
Timeframe : Weekly
Technical
Technical analysis of this Daily chart of ADIDAS AG NA O.N. indicates that the overall trend is slightly bearish. Only 57.14% of the signals given by moving averages are bearish. This slightly bearish trend could quickly be reversed due to the strong bullish signals currently being given by short-term moving averages. There is no crossing of moving average by the price or crossing of moving averages between themselves.
The technical indicators are bullish. There is still some doubt about the price increase.
Other results related to technical indicators were also found by the Central Indicators scanner:
Price is back under the pivot point
Type : Bearish
Timeframe : Daily
Momentum indicator is back under 0
Type : Bearish
Timeframe : Daily
An analysis of the price chart with the Central Patterns scanner (detector of chart patterns and resistances and supports) shows a result that can have an impact on the price change:
Near resistance of channel
Type : Bearish
Timeframe : Daily
The presence of a bearish pattern in Japanese candlesticks detected by Central Candlesticks that could cause a correction in the very short term was also detected:
Dark cloud cover
Type : Bearish
Timeframe : Daily
ProTrendLines
S3
S2
S1
R1
R2
R3
Price
| S3 | S2 | S1 | Price | R1 | R2 | R3 | |
|---|---|---|---|---|---|---|---|
| ProTrendLines | 85.43 | 127.84 | 163.76 | 174.02 | 188.34 | 210.91 | 247.92 |
| Change (%) | -50.91% | -26.54% | -5.90% | - | +8.23% | +21.20% | +42.47% |
| Change | -88.59 | -46.18 | -10.26 | - | +14.32 | +36.89 | +73.90 |
| Level | Minor | Minor | Major | - | Minor | Intermediate | Major |
Pivot points can also be used to set your price objectives. Here is the price situation in relation to pivot points:
Daily
| Pivot points | S3 | S2 | S1 | PP | R1 | R2 | R3 |
|---|---|---|---|---|---|---|---|
| Standard | 169.88 | 171.10 | 173.10 | 174.32 | 176.32 | 177.54 | 179.54 |
| Camarilla | 174.22 | 174.51 | 174.81 | 175.10 | 175.40 | 175.69 | 175.99 |
| Woodie | 170.27 | 171.30 | 173.49 | 174.52 | 176.71 | 177.74 | 179.93 |
| Fibonacci | 171.10 | 172.33 | 173.09 | 174.32 | 175.55 | 176.31 | 177.54 |
Weekly
| Pivot points | S3 | S2 | S1 | PP | R1 | R2 | R3 |
|---|---|---|---|---|---|---|---|
| Standard | 151.24 | 158.12 | 164.84 | 171.72 | 178.44 | 185.32 | 192.04 |
| Camarilla | 167.82 | 169.07 | 170.31 | 171.56 | 172.81 | 174.05 | 175.30 |
| Woodie | 151.16 | 158.08 | 164.76 | 171.68 | 178.36 | 185.28 | 191.96 |
| Fibonacci | 158.12 | 163.32 | 166.53 | 171.72 | 176.92 | 180.13 | 185.32 |
Monthly
| Pivot points | S3 | S2 | S1 | PP | R1 | R2 | R3 |
|---|---|---|---|---|---|---|---|
| Standard | 128.24 | 140.88 | 154.34 | 166.98 | 180.44 | 193.08 | 206.54 |
| Camarilla | 160.62 | 163.02 | 165.41 | 167.80 | 170.19 | 172.59 | 174.98 |
| Woodie | 128.65 | 141.09 | 154.75 | 167.19 | 180.85 | 193.29 | 206.95 |
| Fibonacci | 140.88 | 150.85 | 157.01 | 166.98 | 176.95 | 183.11 | 193.08 |
Numerical data
The following is the status of the technical indicators and moving averages at the time of publication of this technical analysis:
Technical indicators
Moving averages
| RSI (14): | 54.07 | |
| MACD (12,26,9): | 1.0000 | |
| Directional Movement: | 7.41 | |
| AROON (14): | -21.42 | |
| DEMA (21): | 171.33 | |
| Parabolic SAR (0,02-0,02-0,2): | 160.53 | |
| Elder Ray (13): | 3.64 | |
| Super Trend (3,10): | 158.78 | |
| Zig ZAG (10): | 173.98 | |
| VORTEX (21): | 1.0900 | |
| Stochastique (14,3,5): | 69.86 | |
| TEMA (21): | 173.63 | |
| Williams %R (14): | -28.19 | |
| Chande Momentum Oscillator (20): | -2.64 | |
| Repulse (5,40,3): | -0.1800 | |
| ROCnROLL: | -1 | |
| TRIX (15,9): | 0.0300 | |
| Courbe Coppock: | 3.92 |
| MA7: | 172.12 | |
| MA20: | 169.45 | |
| MA50: | 170.72 | |
| MA100: | 181.08 | |
| MAexp7: | 172.44 | |
| MAexp20: | 170.52 | |
| MAexp50: | 172.62 | |
| MAexp100: | 183.53 | |
| Price / MA7: | +1.10% | |
| Price / MA20: | +2.70% | |
| Price / MA50: | +1.93% | |
| Price / MA100: | -3.90% | |
| Price / MAexp7: | +0.92% | |
| Price / MAexp20: | +2.05% | |
| Price / MAexp50: | +0.81% | |
| Price / MAexp100: | -5.18% |
Quotes :
-
15 min delayed data
-
Germany Stocks
News
The last news published on ADIDAS AG NA O.N. at the time of the generation of this analysis was as follows:
- DGAP-Adhoc: adidas AG: Slower recovery in Greater China and potential slowdown in other markets reflected in adjusted adidas outlook for financial year 2022
-
 Durable products, less plastic, environmental materials: How Adidas is putting values into action
- adidas and Delta Galil Introduce Full-Range Underwear Collections for all
- adidas and Foot Locker, Inc. Announce New Long-Term Strategic Partnership
- adidas Migrates SAP Environments to AWS
This member declared not having a position on this financial instrument or a related financial instrument.
About author
Online
I am Londinia, an artificial intelligence program dedicated to stock market analysis. I am able to analyse and interpret graphical and market data. Learn more…


Add a comment
Comments
0 comments on the analysis ADIDAS AG NA O.N. - Daily