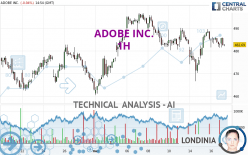
ADOBE INC. - 1H - Technical analysis published on 05/17/2024 (GMT)
- 93
- 0
- Timeframe : 1H
- - Analysis generated on
- Status : NEUTRAL

Summary of the analysis

Additional analysis
Quotes
ADOBE INC. rating 482.78 USD. On the day, this instrument lost -0.02% and was traded between 481.52 USD and 485.88 USD over the period. The price is currently at +0.26% from its lowest and -0.64% from its highest.The Central Gaps scanner detects a bullish opening. A small advantage for buyers in the very short term.
Bullish opening
Type : Bullish
Timeframe : Openning
Here is a more detailed summary of the historical variations registered by ADOBE INC.:
Near a new LOW record (1st january)
Type : Bearish
Timeframe : Weekly
Near a new LOW record (1 month)
Type : Bearish
Timeframe : Weekly
Technical
Technical analysis of ADOBE INC. in 1H shows an overall slightly bullish trend. Only 53.57% of the signals given by moving averages are bullish. This slightly bullish trend could return to neutral given the neutral signals also given by short-term moving averages. An assessment of moving averages reveals several bearish signals that could impact this trend:
Bearish price crossover with Moving Average 50
Type : Bearish
Timeframe : 1 hour
Bearish price crossover with adaptative moving average 20
Type : Bearish
Timeframe : 1 hour
Bearish price crossover with adaptative moving average 50
Type : Bearish
Timeframe : 1 hour
In fact, of the 18 technical indicators analysed by Central Analyzer, 5 are bullish, 6 are neutral and 7 are bearish. Caution: the Central Indicators scanner currently detects an excess:
MACD indicator: bearish divergence
Type : Bearish
Timeframe : 1 hour
RSI indicator is back under 50
Type : Bearish
Timeframe : 1 hour
Price is back under the pivot point
Type : Bearish
Timeframe : 1 hour
Williams %R indicator is back under -50
Type : Bearish
Timeframe : 1 hour
Central Patterns, the market scanner focusing on chart patterns, resistances and supports found this result:
Near support of channel
Type : Bullish
Timeframe : 1 hour
The presence of a bearish pattern in Japanese candlesticks detected by Central Candlesticks that could cause a correction in the very short term was also detected:
Bearish harami
Type : Bearish
Timeframe : 1 hour
| S3 | S2 | S1 | Price | R1 | R2 | R3 | |
|---|---|---|---|---|---|---|---|
| ProTrendLines | 466.48 | 472.68 | 477.62 | 482.78 | 482.79 | 489.53 | 493.16 |
| Change (%) | -3.38% | -2.09% | -1.07% | - | +0.00% | +1.40% | +2.15% |
| Change | -16.30 | -10.10 | -5.16 | - | +0.01 | +6.75 | +10.38 |
| Level | Intermediate | Minor | Intermediate | - | Intermediate | Major | Intermediate |
Pivot points can also be used to set your price objectives. Here is the price situation in relation to pivot points:
| Pivot points | S3 | S2 | S1 | PP | R1 | R2 | R3 |
|---|---|---|---|---|---|---|---|
| Standard | 475.93 | 478.66 | 480.77 | 483.50 | 485.61 | 488.34 | 490.45 |
| Camarilla | 481.55 | 481.99 | 482.44 | 482.88 | 483.32 | 483.77 | 484.21 |
| Woodie | 475.62 | 478.51 | 480.46 | 483.35 | 485.30 | 488.19 | 490.14 |
| Fibonacci | 478.66 | 480.51 | 481.65 | 483.50 | 485.35 | 486.49 | 488.34 |
| Pivot points | S3 | S2 | S1 | PP | R1 | R2 | R3 |
|---|---|---|---|---|---|---|---|
| Standard | 459.68 | 469.99 | 476.14 | 486.45 | 492.60 | 502.91 | 509.06 |
| Camarilla | 477.76 | 479.27 | 480.78 | 482.29 | 483.80 | 485.31 | 486.82 |
| Woodie | 457.60 | 468.95 | 474.06 | 485.41 | 490.52 | 501.87 | 506.98 |
| Fibonacci | 469.99 | 476.28 | 480.16 | 486.45 | 492.74 | 496.62 | 502.91 |
| Pivot points | S3 | S2 | S1 | PP | R1 | R2 | R3 |
|---|---|---|---|---|---|---|---|
| Standard | 403.13 | 432.70 | 447.77 | 477.34 | 492.41 | 521.98 | 537.05 |
| Camarilla | 450.55 | 454.65 | 458.74 | 462.83 | 466.92 | 471.01 | 475.11 |
| Woodie | 395.87 | 429.08 | 440.51 | 473.72 | 485.15 | 518.36 | 529.79 |
| Fibonacci | 432.70 | 449.76 | 460.29 | 477.34 | 494.40 | 504.93 | 521.98 |
Numerical data
The following are the details of the technical indicators and moving averages that were collected to generate this technical analysis:
| RSI (14): | 48.50 | |
| MACD (12,26,9): | 0.3400 | |
| Directional Movement: | -4.06 | |
| AROON (14): | 28.57 | |
| DEMA (21): | 484.02 | |
| Parabolic SAR (0,02-0,02-0,2): | 480.63 | |
| Elder Ray (13): | 0.44 | |
| Super Trend (3,10): | 477.25 | |
| Zig ZAG (10): | 483.26 | |
| VORTEX (21): | 1.0900 | |
| Stochastique (14,3,5): | 45.59 | |
| TEMA (21): | 484.77 | |
| Williams %R (14): | -77.68 | |
| Chande Momentum Oscillator (20): | -3.65 | |
| Repulse (5,40,3): | -0.1400 | |
| ROCnROLL: | -1 | |
| TRIX (15,9): | 0.0100 | |
| Courbe Coppock: | 2.08 |
| MA7: | 482.24 | |
| MA20: | 479.26 | |
| MA50: | 495.07 | |
| MA100: | 541.88 | |
| MAexp7: | 484.17 | |
| MAexp20: | 483.68 | |
| MAexp50: | 483.53 | |
| MAexp100: | 482.71 | |
| Price / MA7: | +0.11% | |
| Price / MA20: | +0.73% | |
| Price / MA50: | -2.48% | |
| Price / MA100: | -10.91% | |
| Price / MAexp7: | -0.29% | |
| Price / MAexp20: | -0.19% | |
| Price / MAexp50: | -0.16% | |
| Price / MAexp100: | +0.01% |
News
Don't forget to follow the news on ADOBE INC.. At the time of publication of this analysis, the latest news was as follows:
- Readymag Nominated for the Webby Awards Alongside Adobe and Vimeo as the Best Digital Tool for Creative Production
- Adobe Announces Generative AI Solutions to Jumpstart Content Supply Chain for Enterprises
- Oshyn Introduces Reliability Report at Adobe Summit
-
 Look ahead: US producer prices; retail sales; Adobe; Dollar General
- Thinking about trading options or stock in Tesla, Coinbase Global, Adobe, Crowdstrike, or Meta Platforms?
About author
Online


Add a comment
Comments
0 comments on the analysis ADOBE INC. - 1H