ALTRIA GROUP INC.
> Analyses

 Thank you
Reply
Chart

tasciccac has published a new analysis.
- 21
- 93
- 272
- 94

Timeframe : Daily - Chart + Trading signal
If this signal is confirmed by a closure above Kijun Sen (71.30$) in the coming day, I expect a swing to target SSB 73.67.
Chikou is above its SSB the support , and a twist of the cloud is above…
BBVA
> Analyses

 Thank you
Reply
Chart

tasciccac has published a new analysis.
- 21
- 93
- 272
- 94

Timeframe : Daily - Chart + Trading signal
Since the the bullish gap of April the prices evolve in a descending triangle, the tip of the triangle is into the #Ichimoku cloud.
In case of breakout of the bottom of the triangle, materialized…
SUPERSONIC IMAGINE > Analyses

 Thank you
Reply

tasciccac has published a new analysis.
- 21
- 93
- 272
- 94

Timeframe : Daily - Chart + Trading signal
The last prices evolution looks like an inverse head & shoulders pattern, with the last shoulders above the Kumo. (Ichimoku cloud)
In case of breakout of the neckline at 2€, I expect a rally…
VALERO ENERGY CORP.
> Analyses

 Thank you
Reply
Chart

tasciccac has published a new analysis.
- 21
- 93
- 272
- 94

Timeframe : Weekly - Simple chart
Next week the candle will evolve above a twist of the cloud, we have 2 flat levels of SSB 59.14 - 60.38 this area could be a support to target a bounce on Tenkan Sen otherwise if this area doesn't…
DISCOVER FINANCIAL SERVICES
> Analyses

 Thank you
Reply
Chart

tasciccac has published a new analysis.
- 21
- 93
- 272
- 94

Timeframe : Weekly - Chart + Trading signal
The price sharply retrace the bullish leg of the year 2016, the current bearish movement seems to loose momentum with the contact of the Ichimoku cloud.
In case of crossing of the last highest, I…
WELLTOWER INC.
> Analyses

 Thank you
Reply
Chart

tasciccac has published a new analysis.
- 21
- 93
- 272
- 94

Timeframe : Weekly - Chart + One way trading
By drawing lines passing through the tops & bottoms we can see 2 symmetrical triangles.
The exit of the small triangle could trigger a move to the border of the bigger triangle.
O REILLY AUTOMOTIVE INC.
> Analyses

 Thank you
Reply
Chart

tasciccac has published a new analysis.
- 21
- 93
- 272
- 94

Timeframe : Weekly - Simple chart
Since 2015 the prices evolve below a parabolic rounding top.
The prices are now below the #Ichimoku cloud, and Chikou have to confirm. If Chikou confirms the bearish breakout I will privilege the…
REXEL
> Analyses

 Thank you
Reply
Chart

tasciccac has published a new analysis.
- 21
- 93
- 272
- 94

Timeframe : Weekly - Chart + Trading signal
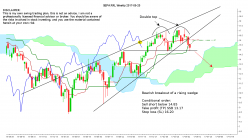
Since early 2016 the prices have formed a rising wedge, the before last week close below this wedge and this week the lower shadow of the candle tests the neckline of the double top.
The swing…
NIKE INC.
> Analyses

 Thank you
Reply
Chart

tasciccac has published a new analysis.
- 21
- 93
- 272
- 94

Timeframe : Daily - Chart + Trading signal
Nice pullback on a broken bullish trend line & Kijun below #Ichimoku cloud
If Chikou confirms the breakout, I expect a bearish swing until 52.50
MINT
> Analyses

 Thank you
Reply
Chart

tasciccac has published a new analysis.
- 21
- 93
- 272
- 94

Timeframe : Daily - Chart + One way trading
En traçant des lignes passant par les derniers extrêmes, apparaît un triangle symétrique. Pour connaitre la nouvelle tendance on surveillera le franchissement de cette figure ainsi que la…


