Analyses of Traders and financial instruments followed by Trader EN - Page 2
Sort : Latest comments | Latest posted
WALT DISNEY CO.
> Analyses

 Thank you
Reply
Chart

tasciccac has published a new analysis.
- 21
- 93
- 272
- 94

Timeframe : Weekly - Simple chart
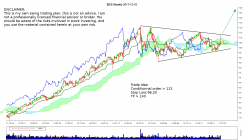
The tops are less and less highs, while the bottoms are more and more highs the prices evolve inside a symmetrical triangle since 2.5 years.
The bullish exit of this pattern could restore the…
KIMBERLY-CLARK CORP.
> Analyses

 Thank you
Reply
Chart

tasciccac has published a new analysis.
- 21
- 93
- 272
- 94

Timeframe : Weekly - Chart + Trading signal
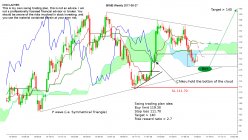
Since 2 years the prices evolve in a symmetrical triangle, called too P wave in #Ichimoku.
The return to the bottom of this figure could be a buying opportunity.
I will prepare the following…
CISCO SYSTEMS INC.
> Analyses

 Thank you
Reply
Chart

tasciccac has published a new analysis.
- 21
- 93
- 272
- 94

Timeframe : Weekly - Chart + Trading signal
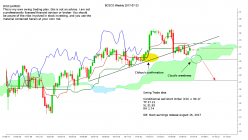
Above a weakness of the Ichimoku cloud, in case of crossing below the first flat SSB level at 30.17 a bearish leg to another flat SSB level at 27.21 is possible. A protective stop can be set above the…
MICHELIN
> Analyses

 Thank you
Reply
Chart

tasciccac has published a new analysis.
- 21
- 93
- 272
- 94

Timeframe : Weekly - Simple chart
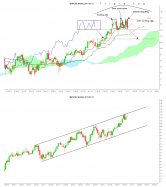
The weekly candles have done a succession of three remarkable bearish reversal patterns, below the top of a multi-years bullish channel.
First an evening star, then a dark cloud cover and last but…
LOWE S COMPANIES INC.
> Analyses

 Thank you
Reply
Chart

tasciccac has published a new analysis.
- 21
- 93
- 272
- 94

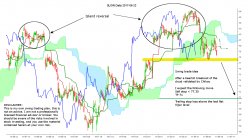
Timeframe : Daily - Chart + Trading signal
A bearish island reversal is appeared, if Chikou confirms the bearish breakout of the cloud done by the candles
I expect the following move
Sell stop < 77.30
TP 71
Trailing stop above the…
GILEAD SCIENCES INC.
> Analyses

 Thank you
Reply
Chart

tasciccac has published a new analysis.
- 21
- 93
- 272
- 94

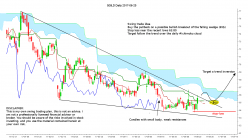
Timeframe : Daily - Chart + Trading signal
The last semester the prices evolve into a falling wedge, in case of bullish breakout of this pattern I will apply the following plan:
Buy the pullback on the falling wedge (65$)
Stop loss near…
SNAP INC. CLASS A
> Analyses

 Thank you
Reply
Chart

tasciccac has published a new analysis.
- 21
- 93
- 272
- 94

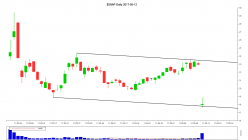
Timeframe : Daily - Simple chart
A dead cat bounce is possible on the bottom of this bearish channel
W.W. GRAINGER INC.
> Analyses

 Thank you
Reply
Chart

tasciccac has published a new analysis.
- 21
- 93
- 272
- 94

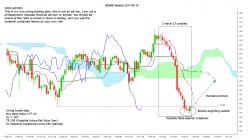
Timeframe : Weekly - Chart + Trading signal
After a severe sequence of 17 bearish candles (17 is a special number in #Ichimoku cycle) we have this week a bullish engulfing candle.
In case of confirmation of the false bearish breakout of the…
ALPHABET INC. CLASS A
> Analyses

 Thank you
Reply
Chart

tasciccac has published a new analysis.
- 21
- 93
- 272
- 94

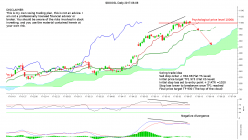
Timeframe : Daily - Chart + Trading signal
It has been more than a month since RSI 14 days is in its overbought zone, and now around the psychological price level of 1000$ negative divergence appear
I prepare the following plan, in the case…
S.E.B.
> Analyses

 Thank you
Reply
Chart

tasciccac has published a new analysis.
- 21
- 93
- 272
- 94

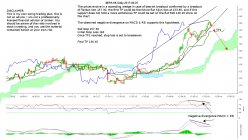
Timeframe : Daily - Chart + Trading signal
The prices evolve in a ascending wedge in case of bearish breakout confirmed by a breakout of Tenkan Sen 157.30, the first TP could be the future flat Kijun Sen at 153.85, and if this support does not…


