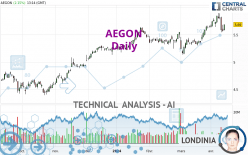
AEGON - Daily - Technical analysis published on 04/15/2024 (GMT)
- 85
- 0
Click here for a new analysis!
- Timeframe : Daily
- - Analysis generated on
- Status : TARGET REACHED

Summary of the analysis

Additional analysis
Quotes
The AEGON rating is 5.690 EUR. On the day, this instrument gained +2.15% and was between 5.580 EUR and 5.690 EUR. This implies that the price is at +1.97% from its lowest and at 0% from its highest.The Central Gaps scanner detects a bullish opening marking the presence of buyers ahead of sellers at the opening but not sufficiently marked to allow the price to register a quotation gap.
Bullish opening
Type : Bullish
Timeframe : Openning
So that you have an overall view of the price change, here is a table showing the variations over several periods:
Near a new HIGH record (5 years)
Type : Bullish
Timeframe : Weekly
Near a new HIGH record (1 year)
Type : Bullish
Timeframe : Weekly
Near a new HIGH record (1st january)
Type : Bullish
Timeframe : Weekly
Near a new LOW record (1 month)
Type : Bearish
Timeframe : Weekly
Technical
Technical analysis of this Daily chart of AEGON indicates that the overall trend is strongly bullish. 92.86% of the signals given by moving averages are bullish. This strongly bullish trend is supported by the strong bullish signals given by short-term moving averages. An assessment of moving averages reveals several bullish signals that could impact this trend:
Bullish price crossover with Moving Average 20
Type : Bullish
Timeframe : Daily
Bullish price crossover with adaptative moving average 20
Type : Bullish
Timeframe : Daily
An assessment of technical indicators does not currently provide any relevant information to suggest whether the signal given by the technical indicators is more bullish or bearish.
Other results related to technical indicators were also found by the Central Indicators scanner:
Pivot points : price is over resistance 1
Type : Neutral
Timeframe : Daily
RSI indicator is back over 50
Type : Bullish
Timeframe : Daily
Price is back over the pivot point
Type : Bullish
Timeframe : Weekly
Momentum indicator is back over 0
Type : Bullish
Timeframe : Daily
The analysis of the price chart with Central Patterns scanners does not return any result.
The Central Candlesticks scanner which studies Japanese candlesticks did not detect anything.
| S3 | S2 | S1 | Price | R1 | |
|---|---|---|---|---|---|
| ProTrendLines | 4.956 | 5.168 | 5.546 | 5.690 | 5.848 |
| Change (%) | -12.90% | -9.17% | -2.53% | - | +2.78% |
| Change | -0.734 | -0.522 | -0.144 | - | +0.158 |
| Level | Major | Intermediate | Major | - | Minor |
To determine price objectives, it is also possible to use the pivot points. Here is the price position in relation to pivot points:
| Pivot points | S3 | S2 | S1 | PP | R1 | R2 | R3 |
|---|---|---|---|---|---|---|---|
| Standard | 5.400 | 5.478 | 5.524 | 5.602 | 5.648 | 5.726 | 5.772 |
| Camarilla | 5.536 | 5.547 | 5.559 | 5.570 | 5.581 | 5.593 | 5.604 |
| Woodie | 5.384 | 5.470 | 5.508 | 5.594 | 5.632 | 5.718 | 5.756 |
| Fibonacci | 5.478 | 5.525 | 5.555 | 5.602 | 5.649 | 5.679 | 5.726 |
| Pivot points | S3 | S2 | S1 | PP | R1 | R2 | R3 |
|---|---|---|---|---|---|---|---|
| Standard | 5.093 | 5.319 | 5.445 | 5.671 | 5.797 | 6.023 | 6.149 |
| Camarilla | 5.473 | 5.506 | 5.538 | 5.570 | 5.602 | 5.635 | 5.667 |
| Woodie | 5.042 | 5.294 | 5.394 | 5.646 | 5.746 | 5.998 | 6.098 |
| Fibonacci | 5.319 | 5.454 | 5.537 | 5.671 | 5.806 | 5.889 | 6.023 |
| Pivot points | S3 | S2 | S1 | PP | R1 | R2 | R3 |
|---|---|---|---|---|---|---|---|
| Standard | 4.767 | 4.951 | 5.301 | 5.485 | 5.835 | 6.019 | 6.369 |
| Camarilla | 5.503 | 5.552 | 5.601 | 5.650 | 5.699 | 5.748 | 5.797 |
| Woodie | 4.849 | 4.993 | 5.383 | 5.527 | 5.917 | 6.061 | 6.451 |
| Fibonacci | 4.951 | 5.155 | 5.281 | 5.485 | 5.689 | 5.815 | 6.019 |
Numerical data
The following are the details of the technical indicators and moving averages that were collected to generate this technical analysis:
| RSI (14): | 56.04 | |
| MACD (12,26,9): | 0.0750 | |
| Directional Movement: | 0.035 | |
| AROON (14): | 71.429 | |
| DEMA (21): | 5.725 | |
| Parabolic SAR (0,02-0,02-0,2): | 5.887 | |
| Elder Ray (13): | -0.030 | |
| Super Trend (3,10): | 5.953 | |
| Zig ZAG (10): | 5.688 | |
| VORTEX (21): | 1.0900 | |
| Stochastique (14,3,5): | 37.88 | |
| TEMA (21): | 5.753 | |
| Williams %R (14): | -50.97 | |
| Chande Momentum Oscillator (20): | 0.040 | |
| Repulse (5,40,3): | -0.6540 | |
| ROCnROLL: | 1 | |
| TRIX (15,9): | 0.2270 | |
| Courbe Coppock: | 8.81 |
| MA7: | 5.722 | |
| MA20: | 5.610 | |
| MA50: | 5.473 | |
| MA100: | 5.364 | |
| MAexp7: | 5.684 | |
| MAexp20: | 5.624 | |
| MAexp50: | 5.502 | |
| MAexp100: | 5.331 | |
| Price / MA7: | -0.56% | |
| Price / MA20: | +1.43% | |
| Price / MA50: | +3.96% | |
| Price / MA100: | +6.08% | |
| Price / MAexp7: | +0.11% | |
| Price / MAexp20: | +1.17% | |
| Price / MAexp50: | +3.42% | |
| Price / MAexp100: | +6.73% |
News
The last news published on AEGON at the time of the generation of this analysis was as follows:
- Clearwater Successfully Implements PRISM for Aegon Asset Management to Help Support Business Growth
- Clearwater Successfully Implements PRISM for Aegon Asset Management to Help Support Business Growth
- Redomiciliation to Bermuda completed
- Extraordinary General Meeting approves first step in redomiciliation to Bermuda
- Aegon publishes agenda for Extraordinary General Meetings on September 29 and September 30, 2023
About author
Online


Add a comment
Comments
0 comments on the analysis AEGON - Daily