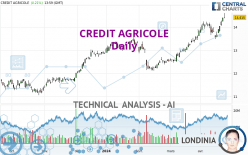
CREDIT AGRICOLE - Daily - Technical analysis published on 04/24/2024 (GMT)
- 74
- 0
Click here for a new analysis!
- Timeframe : Daily
- - Analysis generated on
- Status : TARGET REACHED

Summary of the analysis

Additional analysis
Quotes
The CREDIT AGRICOLE price is 14.415 EUR. The price has increased by +0.21% since the last closing and was traded between 14.375 EUR and 14.600 EUR over the period. The price is currently at +0.28% from its lowest and -1.27% from its highest.A bullish opening was detected by the Central Gaps scanner. Buyers are trying to impose a bullish momentum in the very short term.
Bullish opening
Type : Bullish
Timeframe : Openning
So that you have an overall view of the price change, here is a table showing the variations over several periods:
New HIGH record (5 years)
Type : Bullish
Timeframe : Weekly
New HIGH record (1 year)
Type : Bullish
Timeframe : Weekly
New HIGH record (1st january)
Type : Bullish
Timeframe : Weekly
New HIGH record (1 month)
Type : Bullish
Timeframe : Weekly
Technical
Technical analysis of CREDIT AGRICOLE in Daily shows a strongly overall bullish trend. 92.86% of the signals given by moving averages are bullish. The overall trend is supported by the strong bullish signals from short-term moving averages. The Central Indicators scanner does not detect any result on moving averages that would impact this trend.
In fact, according to the parameters integrated into the Central Analyzer system, 13 technical indicators out of 18 analysed are currently bullish. Caution: the Central Indicators scanner currently detects an excess:
RSI indicator is overbought : over 70
Type : Neutral
Timeframe : Daily
CCI indicator is overbought : over 100
Type : Neutral
Timeframe : Daily
Williams %R indicator is overbought : over -20
Type : Neutral
Timeframe : Daily
Pivot points : price is over resistance 2
Type : Neutral
Timeframe : Weekly
An analysis of the price chart with the Central Patterns scanner (detector of chart patterns and resistances and supports) shows several results that can have an impact on the price change:
Near resistance of channel
Type : Bearish
Timeframe : Daily
Near horizontal support
Type : Bullish
Timeframe : Daily
Central Candlesticks, the scanner specialised in Japanese candlesticks, detects this inversion signal that could impact the current short-term trend:
Doji
Type : Neutral
Timeframe : Daily
| S3 | S2 | S1 | Price | |
|---|---|---|---|---|
| ProTrendLines | 12.599 | 13.468 | 14.145 | 14.415 |
| Change (%) | -12.60% | -6.57% | -1.87% | - |
| Change | -1.816 | -0.947 | -0.270 | - |
| Level | Minor | Major | Minor | - |
To determine price objectives, it is also possible to use the pivot points. Here is the price position in relation to pivot points:
| Pivot points | S3 | S2 | S1 | PP | R1 | R2 | R3 |
|---|---|---|---|---|---|---|---|
| Standard | 14.110 | 14.175 | 14.280 | 14.345 | 14.450 | 14.515 | 14.620 |
| Camarilla | 14.338 | 14.354 | 14.369 | 14.385 | 14.401 | 14.416 | 14.432 |
| Woodie | 14.130 | 14.185 | 14.300 | 14.355 | 14.470 | 14.525 | 14.640 |
| Fibonacci | 14.175 | 14.240 | 14.280 | 14.345 | 14.410 | 14.450 | 14.515 |
| Pivot points | S3 | S2 | S1 | PP | R1 | R2 | R3 |
|---|---|---|---|---|---|---|---|
| Standard | 13.087 | 13.278 | 13.657 | 13.848 | 14.227 | 14.418 | 14.797 |
| Camarilla | 13.878 | 13.931 | 13.983 | 14.035 | 14.087 | 14.140 | 14.192 |
| Woodie | 13.180 | 13.325 | 13.750 | 13.895 | 14.320 | 14.465 | 14.890 |
| Fibonacci | 13.278 | 13.496 | 13.631 | 13.848 | 14.066 | 14.201 | 14.418 |
| Pivot points | S3 | S2 | S1 | PP | R1 | R2 | R3 |
|---|---|---|---|---|---|---|---|
| Standard | 11.473 | 11.965 | 12.891 | 13.383 | 14.309 | 14.801 | 15.727 |
| Camarilla | 13.426 | 13.556 | 13.686 | 13.816 | 13.946 | 14.076 | 14.206 |
| Woodie | 11.689 | 12.074 | 13.107 | 13.492 | 14.525 | 14.910 | 15.943 |
| Fibonacci | 11.965 | 12.507 | 12.842 | 13.383 | 13.925 | 14.260 | 14.801 |
Numerical data
The following is the status of technical indicators and moving averages registered at the time this technical analysis was created:
| RSI (14): | 73.27 | |
| MACD (12,26,9): | 0.2580 | |
| Directional Movement: | 23.797 | |
| AROON (14): | 42.857 | |
| DEMA (21): | 14.225 | |
| Parabolic SAR (0,02-0,02-0,2): | 13.523 | |
| Elder Ray (13): | 0.474 | |
| Super Trend (3,10): | 13.791 | |
| Zig ZAG (10): | 14.425 | |
| VORTEX (21): | 1.1740 | |
| Stochastique (14,3,5): | 91.29 | |
| TEMA (21): | 14.279 | |
| Williams %R (14): | -15.49 | |
| Chande Momentum Oscillator (20): | 0.290 | |
| Repulse (5,40,3): | 1.6500 | |
| ROCnROLL: | 1 | |
| TRIX (15,9): | 0.2720 | |
| Courbe Coppock: | 2.63 |
| MA7: | 14.029 | |
| MA20: | 13.948 | |
| MA50: | 13.218 | |
| MA100: | 13.063 | |
| MAexp7: | 14.150 | |
| MAexp20: | 13.881 | |
| MAexp50: | 13.462 | |
| MAexp100: | 13.024 | |
| Price / MA7: | +2.75% | |
| Price / MA20: | +3.35% | |
| Price / MA50: | +9.06% | |
| Price / MA100: | +10.35% | |
| Price / MAexp7: | +1.87% | |
| Price / MAexp20: | +3.85% | |
| Price / MAexp50: | +7.08% | |
| Price / MAexp100: | +10.68% |
News
The last news published on CREDIT AGRICOLE at the time of the generation of this analysis was as follows:
- Release of the 2023 Credit Agricole Assurances group’s SFCR
- CREDIT AGRICOLE SA: Availability of Crédit Agricole S.A.’s 2023 Universal Registration Document and Annual Financial Report
- Crédit Agricole S.A. announces the reduction of its share capital through the cancellation of treasury shares purchased under a share repurchase program
- CREDIT AGRICOLE SA: Fourth quarter and full-year 2023 - VERY GOOD RESULTS IN 2023
- CREDIT AGRICOLE SA: End of Crédit Agricole S.A.’s share repurchase program
About author

Online


Add a comment
Comments
0 comments on the analysis CREDIT AGRICOLE - Daily