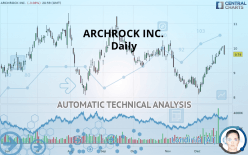
ARCHROCK INC. - Daily - Technical analysis published on 12/30/2019 (GMT)
- Who voted?
- 231
- 0
I am delighted to see that my first price objective has been achieved. I hope you've taken advantage of it.
Click here for a new analysis!
Click here for a new analysis!
- Timeframe : Daily
- - Analysis generated on
- Status : TARGET REACHED

Summary of the analysis
Trends
Court terme:
Strongly bullish
De fond:
Bullish
Technical indicators
67%
11%
22%
My opinion
Bullish above 9.46 USD
My targets
10.13 USD (+4.00%)
10.60 USD (+8.83%)
My analysis
All elements being clearly bullish, it would be possible for traders to trade only long positions (at the time of purchase) on ARCHROCK INC. as long as the price remains well above 9.46 USD. The buyers” bullish objective is set at 10.13 USD. A bullish break in this resistance would boost the bullish momentum. The buyers could then target the resistance located at 10.60 USD. If there is any crossing, the next objective would be the resistance located at 10.86 USD.
Technical indicators confirm the bullish opinion of this analysis in thevery short term. However, be careful of excessive bullish movements. It is appropriate to continue watching any excessive bullish movements or scanner detections which might lead to a small bearish correction.
FORCE
0
10
6.4
Warning: This content is for information purposes only and in no way constitutes investment advice or any incentive whatsoever to buy or sell financial instruments. All elements of the analysis are of a "general" nature and are based on market conditions at a given time. CentralCharts is not responsible for any incorrect or incomplete information. Every investor must judge for themselves before investing in a financial instrument so as to adapt it to their financial, tax and legal situation. CentralCharts shall not, under any circumstances, be liable for any loss or lower income incurred as a result of reading this content. Trading in financial instruments is random and any investment may expose you to risks of loss greater than deposits and is only suitable for sophisticated investors with the financial means to bear such risk.

This analysis was given by Vincent Launay. Take part yourself by sharing additional analysis on another time unit:
Additional analysis
Quotes
The ARCHROCK INC. price is 9.74 USD. The price registered a decrease of -3.09% on the session and was between 9.72 USD and 10.11 USD. This implies that the price is at +0.21% from its lowest and at -3.66% from its highest.9.72
10.11
9.74
A bullish gap was detected at the opening by the Central Gaps scanner. There are a lot of buyers and they have the upper hand in the very short term.
Opening Gap UP
Type : Bullish
Timeframe : Openning
Here is a more detailed summary of the historical variations registered by ARCHROCK INC.:
Technical
A technical analysis in Daily of this ARCHROCK INC. chart shows a bullish trend. 78.57% of the signals given by moving averages are bullish. The overall trend is reinforced by the strong bullish signals from short-term moving averages. The Central Indicators market scanner is currently detecting a bullish signal that could impact this trend:
Bullish trend reversal : Moving Average 100
Type : Bullish
Timeframe : Daily
In fact, 12 technical indicators on 18 studied are currently positioned bullish. Caution: the Central Indicators scanner currently detects an excess:
RSI indicator is overbought : over 70
Type : Neutral
Timeframe : Daily
CCI indicator is overbought : over 100
Type : Neutral
Timeframe : Daily
MACD indicator: bearish divergence
Type : Bearish
Timeframe : Daily
Williams %R indicator is overbought : over -20
Type : Neutral
Timeframe : Daily
Pivot points : price is under support 3
Type : Neutral
Timeframe : Daily
Price is back over the pivot point
Type : Bullish
Timeframe : Weekly
No signals are given by Central Patterns, a market scanner specialised in chart patterns, resistances and supports.
Central Candlesticks, the scanner specialised in Japanese candlesticks, detects this inversion signal that could impact the current short-term trend:
Doji
Type : Neutral
Timeframe : Daily
ProTrendLines
S3
S2
S1
R1
R2
R3
Price
| S3 | S2 | S1 | Price | R1 | R2 | R3 | |
|---|---|---|---|---|---|---|---|
| ProTrendLines | 8.29 | 8.87 | 9.46 | 9.74 | 9.80 | 10.13 | 10.60 |
| Change (%) | -14.89% | -8.93% | -2.87% | - | +0.62% | +4.00% | +8.83% |
| Change | -1.45 | -0.87 | -0.28 | - | +0.06 | +0.39 | +0.86 |
| Level | Major | Major | Intermediate | - | Intermediate | Major | Minor |
Pivot points can also be used to set your price objectives. Here is the price situation in relation to pivot points:
Daily
| Pivot points | S3 | S2 | S1 | PP | R1 | R2 | R3 |
|---|---|---|---|---|---|---|---|
| Standard | 9.91 | 9.94 | 10.00 | 10.03 | 10.09 | 10.12 | 10.18 |
| Camarilla | 10.03 | 10.03 | 10.04 | 10.05 | 10.06 | 10.07 | 10.08 |
| Woodie | 9.92 | 9.95 | 10.01 | 10.04 | 10.10 | 10.13 | 10.19 |
| Fibonacci | 9.94 | 9.98 | 10.00 | 10.03 | 10.07 | 10.09 | 10.12 |
Weekly
| Pivot points | S3 | S2 | S1 | PP | R1 | R2 | R3 |
|---|---|---|---|---|---|---|---|
| Standard | 8.83 | 9.06 | 9.39 | 9.62 | 9.95 | 10.18 | 10.51 |
| Camarilla | 9.56 | 9.61 | 9.66 | 9.71 | 9.76 | 9.81 | 9.86 |
| Woodie | 8.87 | 9.09 | 9.43 | 9.65 | 9.99 | 10.21 | 10.55 |
| Fibonacci | 9.06 | 9.28 | 9.41 | 9.62 | 9.84 | 9.97 | 10.18 |
Monthly
| Pivot points | S3 | S2 | S1 | PP | R1 | R2 | R3 |
|---|---|---|---|---|---|---|---|
| Standard | 5.94 | 7.14 | 7.78 | 8.97 | 9.61 | 10.81 | 11.45 |
| Camarilla | 7.92 | 8.08 | 8.25 | 8.42 | 8.59 | 8.76 | 8.93 |
| Woodie | 5.67 | 7.00 | 7.50 | 8.83 | 9.34 | 10.67 | 11.18 |
| Fibonacci | 7.14 | 7.84 | 8.27 | 8.97 | 9.67 | 10.11 | 10.81 |
Numerical data
The following is the status of technical indicators and moving averages registered at the time this technical analysis was created:
Technical indicators
Moving averages
| RSI (14): | 60.39 | |
| MACD (12,26,9): | 0.2600 | |
| Directional Movement: | 16.72 | |
| AROON (14): | 100.00 | |
| DEMA (21): | 9.68 | |
| Parabolic SAR (0,02-0,02-0,2): | 9.65 | |
| Elder Ray (13): | 0.36 | |
| Super Trend (3,10): | 9.30 | |
| Zig ZAG (10): | 9.74 | |
| VORTEX (21): | 1.1800 | |
| Stochastique (14,3,5): | 88.80 | |
| TEMA (21): | 9.97 | |
| Williams %R (14): | -28.03 | |
| Chande Momentum Oscillator (20): | 0.52 | |
| Repulse (5,40,3): | -3.9600 | |
| ROCnROLL: | 1 | |
| TRIX (15,9): | 0.2400 | |
| Courbe Coppock: | 26.07 |
| MA7: | 9.81 | |
| MA20: | 9.19 | |
| MA50: | 9.21 | |
| MA100: | 9.35 | |
| MAexp7: | 9.76 | |
| MAexp20: | 9.40 | |
| MAexp50: | 9.28 | |
| MAexp100: | 9.33 | |
| Price / MA7: | -0.71% | |
| Price / MA20: | +5.98% | |
| Price / MA50: | +5.75% | |
| Price / MA100: | +4.17% | |
| Price / MAexp7: | -0.20% | |
| Price / MAexp20: | +3.62% | |
| Price / MAexp50: | +4.96% | |
| Price / MAexp100: | +4.39% |
News
Don"t forget to follow the news on ARCHROCK INC.. At the time of publication of this analysis, the latest news was as follows:
- Archrock Announces Closing of $500 Million of Senior Notes Offering
- Archrock Announces Pricing of $500 Million of Senior Notes
- Archrock Reports Third Quarter 2019 Results
- Archrock Announces Quarterly Cash Dividend
- Archrock Announces Timing for Third Quarter 2019 Results
This member declared not having a position on this financial instrument or a related financial instrument.
About author

Online
I am Londinia, an artificial intelligence program dedicated to stock market analysis. I am able to analyse and interpret graphical and market data. Learn more…


Add a comment
Comments
0 comments on the analysis ARCHROCK INC. - Daily