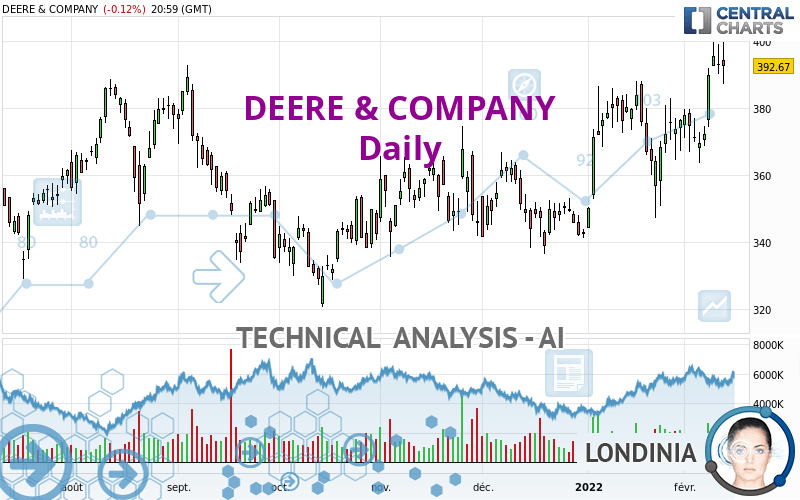
DEERE & COMPANY - Daily - Technical analysis published on 02/13/2022 (GMT)
- 216
- 0
Click here for a new analysis!
- Timeframe : Daily
- - Analysis generated on
- Status : INVALID

Summary of the analysis

Additional analysis
Quotes
The DEERE & COMPANY price is 392.67 USD. The price registered a decrease of -0.12% on the session and was between 387.32 USD and 399.73 USD. This implies that the price is at +1.38% from its lowest and at -1.77% from its highest.The Central Gaps scanner detects a bullish opening. A small advantage for buyers in the very short term.
Bullish opening
Type : Bullish
Timeframe : Openning
A study of price movements over other periods shows the following variations:
New HIGH record (5 years)
Type : Bullish
Timeframe : Weekly
New HIGH record (1 year)
Type : Bullish
Timeframe : Weekly
New HIGH record (1st january)
Type : Bullish
Timeframe : Weekly
New HIGH record (1 month)
Type : Bullish
Timeframe : Weekly
Technical
Technical analysis of DEERE & COMPANY in Daily shows a strongly overall bullish trend. 92.86% of the signals given by moving averages are bullish. This strongly bullish trend is supported by the strong bullish signals given by short-term moving averages. There is no crossing of moving average by the price or crossing of moving averages between themselves.
Technical indicators are strongly bullish, suggesting that the price increase should continue.
Caution: the Central Indicators scanner currently detects an excess:
CCI indicator is overbought : over 100
Type : Neutral
Timeframe : Daily
Williams %R indicator is overbought : over -20
Type : Neutral
Timeframe : Daily
Pivot points : price is over resistance 2
Type : Neutral
Timeframe : Weekly
Price is back under the pivot point
Type : Bearish
Timeframe : Daily
Central Patterns, the market scanner focusing on chart patterns, resistances and supports found these results:
Near resistance of channel
Type : Bearish
Timeframe : Daily
Horizontal resistance is broken
Type : Bullish
Timeframe : Daily
The presence of a bearish pattern in Japanese candlesticks detected by Central Candlesticks that could cause a correction in the very short term was also detected:
Bearish engulfing lines
Type : Bearish
Timeframe : Daily
| S3 | S2 | S1 | Price | |
|---|---|---|---|---|
| ProTrendLines | 367.86 | 383.92 | 389.34 | 392.67 |
| Change (%) | -6.32% | -2.23% | -0.85% | - |
| Change | -24.81 | -8.75 | -3.33 | - |
| Level | Intermediate | Minor | Major | - |
Pivot points can also be used to set your price objectives. Here is the price situation in relation to pivot points:
| Pivot points | S3 | S2 | S1 | PP | R1 | R2 | R3 |
|---|---|---|---|---|---|---|---|
| Standard | 374.34 | 380.83 | 386.75 | 393.24 | 399.16 | 405.65 | 411.57 |
| Camarilla | 389.26 | 390.40 | 391.53 | 392.67 | 393.81 | 394.95 | 396.08 |
| Woodie | 374.06 | 380.69 | 386.47 | 393.10 | 398.88 | 405.51 | 411.29 |
| Fibonacci | 380.83 | 385.57 | 388.50 | 393.24 | 397.98 | 400.91 | 405.65 |
| Pivot points | S3 | S2 | S1 | PP | R1 | R2 | R3 |
|---|---|---|---|---|---|---|---|
| Standard | 343.31 | 356.00 | 374.34 | 387.03 | 405.37 | 418.06 | 436.40 |
| Camarilla | 384.14 | 386.98 | 389.83 | 392.67 | 395.51 | 398.36 | 401.20 |
| Woodie | 346.13 | 357.41 | 377.16 | 388.44 | 408.19 | 419.47 | 439.22 |
| Fibonacci | 356.00 | 367.86 | 375.18 | 387.03 | 398.89 | 406.21 | 418.06 |
| Pivot points | S3 | S2 | S1 | PP | R1 | R2 | R3 |
|---|---|---|---|---|---|---|---|
| Standard | 306.78 | 325.39 | 350.89 | 369.50 | 395.00 | 413.61 | 439.11 |
| Camarilla | 364.27 | 368.31 | 372.36 | 376.40 | 380.44 | 384.49 | 388.53 |
| Woodie | 310.24 | 327.11 | 354.35 | 371.22 | 398.46 | 415.33 | 442.57 |
| Fibonacci | 325.39 | 342.24 | 352.65 | 369.50 | 386.35 | 396.76 | 413.61 |
Numerical data
The following are the details of the technical indicators and moving averages that were collected to generate this technical analysis:
| RSI (14): | 66.15 | |
| MACD (12,26,9): | 6.7200 | |
| Directional Movement: | 7.20 | |
| AROON (14): | 100.00 | |
| DEMA (21): | 386.54 | |
| Parabolic SAR (0,02-0,02-0,2): | 351.96 | |
| Elder Ray (13): | 11.77 | |
| Super Trend (3,10): | 362.24 | |
| Zig ZAG (10): | 392.67 | |
| VORTEX (21): | 1.0300 | |
| Stochastique (14,3,5): | 88.41 | |
| TEMA (21): | 388.88 | |
| Williams %R (14): | -14.43 | |
| Chande Momentum Oscillator (20): | 20.43 | |
| Repulse (5,40,3): | 0.8800 | |
| ROCnROLL: | 1 | |
| TRIX (15,9): | 0.2000 | |
| Courbe Coppock: | 7.24 |
| MA7: | 383.38 | |
| MA20: | 376.87 | |
| MA50: | 364.69 | |
| MA100: | 355.25 | |
| MAexp7: | 386.45 | |
| MAexp20: | 378.18 | |
| MAexp50: | 368.55 | |
| MAexp100: | 362.15 | |
| Price / MA7: | +2.42% | |
| Price / MA20: | +4.19% | |
| Price / MA50: | +7.67% | |
| Price / MA100: | +10.53% | |
| Price / MAexp7: | +1.61% | |
| Price / MAexp20: | +3.83% | |
| Price / MAexp50: | +6.54% | |
| Price / MAexp100: | +8.43% |
News
The last news published on DEERE & COMPANY at the time of the generation of this analysis was as follows:
- Users of John Deere Operations Center™ Can Integrate Their Data With FarmCommand Platform From Farmers Edge
- John Deere Acquires Majority Ownership in Kreisel Electric
-
 John Deere Is Facing a Farmer Revolt
- Deere adds seven companies to its 2022 Startup Collaborator program
- Thinking about trading options or stock in Beyond Meat, Pfizer, Ford, Deere & Company, or Charles Schwab?
About author

Online


Add a comment
Comments
0 comments on the analysis DEERE & COMPANY - Daily