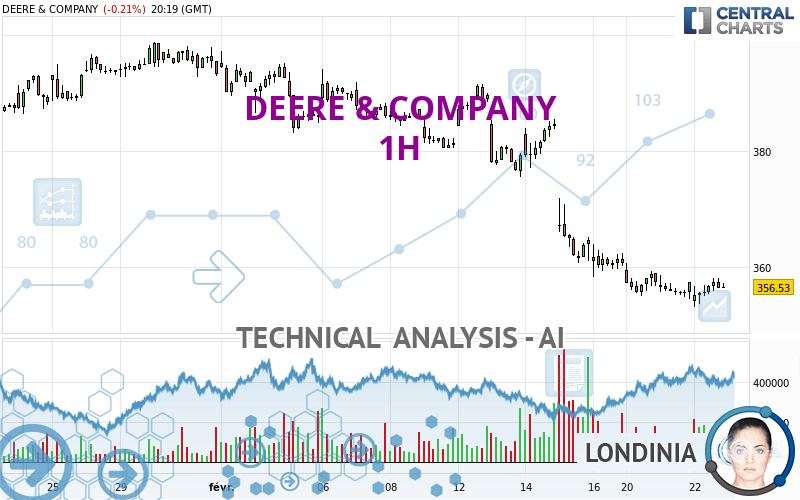
DEERE & COMPANY - 1H - Technical analysis published on 02/22/2024 (GMT)
- 84
- 0
I am pleased to note that the threshold for invalidation has been maintained for 20 Candlesticks.
Click here for a new analysis!
Click here for a new analysis!
- Timeframe : 1H
- - Analysis generated on
- Status : LEVEL MAINTAINED

Summary of the analysis
Trends
Short term:
Bearish
Underlying:
Strongly bearish
Technical indicators
56%
17%
28%
My opinion
Bearish under 370.15 USD
My targets
343.65 USD (-3.76%)
315.54 USD (-11.63%)
My analysis
The bearish basic trend is very strong on DEERE & COMPANY but the short term shows some signs of running out of steam. However, a sale could be considered as long as the price remains below 370.15 USD. Crossing the first support at 343.65 USD would be a sign of a further potential price plummet. Sellers would then use the next support located at 315.54 USD as an objective. Crossing it would then enable sellers to target 284.57 USD. Caution, a return to above the resistance located at 370.15 USD would be a sign of a possible consolidation phase of the short-term basic trend. If this is the case, remember that trading against the trend may be riskier. It would seem more appropriate to wait for a signal indicating reversal of the trend.
In the very short term, the general bearish opinion of this analysis is in opposition with technical indicators. As long as the invalidation level of this analysis is not breached, the bearish direction is still favored, however the current short term correction should be carefully watched.
Force
0
10
3.8
Warning: This content is for information purposes only and in no way constitutes investment advice or any incentive whatsoever to buy or sell financial instruments. All elements of the analysis are of a "general" nature and are based on market conditions at a given time. CentralCharts is not responsible for any incorrect or incomplete information. Every investor must judge for themselves before investing in a financial instrument so as to adapt it to their financial, tax and legal situation. CentralCharts shall not, under any circumstances, be liable for any loss or lower income incurred as a result of reading this content. Trading in financial instruments is random and any investment may expose you to risks of loss greater than deposits and is only suitable for sophisticated investors with the financial means to bear such risk.

This analysis was given by Londinia. Take part yourself by sharing additional analysis on another time unit:
Additional analysis
Quotes
The DEERE & COMPANY rating is 357.06 USD. The price registered a decrease of -0.06% on the session with the lowest point at 353.15 USD and the highest point at 358.14 USD. The deviation from the price is +1.11% for the low point and -0.30% for the high point.353.15
358.14
357.06
The Central Gaps scanner detects the formation of a bearish gap marking the strong presence of sellers ahead of buyers at the opening. This formed a quotation gap.
Opening Gap DOWN
Type : Bearish
Timeframe : Openning
Here is a more detailed summary of the historical variations registered by DEERE & COMPANY:
Near a new LOW record (1 year)
Type : Bearish
Timeframe : Weekly
New LOW record (1st january)
Type : Bearish
Timeframe : Weekly
New LOW record (1 month)
Type : Bearish
Timeframe : Weekly
Technical
Technical analysis of DEERE & COMPANY in 1H shows a overall strongly bearish trend. The signals given by moving averages are 85.71% bearish. This strongly bearish trend seems to be slowing down given the slightly bearish signals being given by short-term moving averages. An assessment of moving averages reveals a bullish signal that could impact this trend:
Bullish price crossover with Moving Average 20
Type : Bullish
Timeframe : 1 hour
The technical indicators are bullish. There is still some doubt about the price increase.
The Central Indicators scanner found this result concerning these indicators:
Momentum indicator is back over 0
Type : Bullish
Timeframe : 1 hour
The Central Patterns scanner, which studies chart patterns, resistances and supports, has identified this signal:
Near horizontal resistance
Type : Bearish
Timeframe : 1 hour
Central Candlesticks, the scanner specialised in Japanese candlesticks, detects a bullish signal that could support the hypothesis of a small rebound in the very short term:
Bullish doji star
Type : Bullish
Timeframe : 1 hour
ProTrendLines
S3
S2
S1
R1
R2
R3
Price
| S3 | S2 | S1 | Price | R1 | R2 | R3 | |
|---|---|---|---|---|---|---|---|
| ProTrendLines | 243.10 | 284.57 | 343.65 | 357.06 | 358.28 | 376.22 | 380.61 |
| Change (%) | -31.92% | -20.30% | -3.76% | - | +0.34% | +5.37% | +6.60% |
| Change | -113.96 | -72.49 | -13.41 | - | +1.22 | +19.16 | +23.55 |
| Level | Minor | Intermediate | Major | - | Major | Minor | Intermediate |
Pivot points can also be used to set your price objectives. Here is the price situation in relation to pivot points:
Daily
| Pivot points | S3 | S2 | S1 | PP | R1 | R2 | R3 |
|---|---|---|---|---|---|---|---|
| Standard | 350.83 | 352.64 | 354.97 | 356.78 | 359.11 | 360.92 | 363.25 |
| Camarilla | 356.15 | 356.53 | 356.91 | 357.29 | 357.67 | 358.05 | 358.43 |
| Woodie | 351.08 | 352.77 | 355.22 | 356.91 | 359.36 | 361.05 | 363.50 |
| Fibonacci | 352.64 | 354.23 | 355.20 | 356.78 | 358.37 | 359.34 | 360.92 |
Weekly
| Pivot points | S3 | S2 | S1 | PP | R1 | R2 | R3 |
|---|---|---|---|---|---|---|---|
| Standard | 315.54 | 336.90 | 348.79 | 370.15 | 382.04 | 403.40 | 415.29 |
| Camarilla | 351.54 | 354.58 | 357.63 | 360.68 | 363.73 | 366.78 | 369.82 |
| Woodie | 310.81 | 334.53 | 344.06 | 367.78 | 377.31 | 401.03 | 410.56 |
| Fibonacci | 336.90 | 349.60 | 357.45 | 370.15 | 382.85 | 390.70 | 403.40 |
Monthly
| Pivot points | S3 | S2 | S1 | PP | R1 | R2 | R3 |
|---|---|---|---|---|---|---|---|
| Standard | 347.31 | 361.77 | 377.67 | 392.13 | 408.03 | 422.49 | 438.39 |
| Camarilla | 385.23 | 388.01 | 390.80 | 393.58 | 396.36 | 399.15 | 401.93 |
| Woodie | 348.04 | 362.13 | 378.40 | 392.49 | 408.76 | 422.85 | 439.12 |
| Fibonacci | 361.77 | 373.36 | 380.53 | 392.13 | 403.72 | 410.89 | 422.49 |
Numerical data
The following are the details of the technical indicators and moving averages that were collected to generate this technical analysis:
Technical indicators
Moving averages
| RSI (14): | 39.72 | |
| MACD (12,26,9): | -2.3600 | |
| Directional Movement: | -4.30 | |
| AROON (14): | -57.14 | |
| DEMA (21): | 354.01 | |
| Parabolic SAR (0,02-0,02-0,2): | 353.35 | |
| Elder Ray (13): | -0.24 | |
| Super Trend (3,10): | 361.79 | |
| Zig ZAG (10): | 356.64 | |
| VORTEX (21): | 0.8900 | |
| Stochastique (14,3,5): | 62.94 | |
| TEMA (21): | 355.65 | |
| Williams %R (14): | -39.82 | |
| Chande Momentum Oscillator (20): | 0.12 | |
| Repulse (5,40,3): | 0.0000 | |
| ROCnROLL: | 2 | |
| TRIX (15,9): | -0.1300 | |
| Courbe Coppock: | 0.56 |
| MA7: | 365.81 | |
| MA20: | 381.96 | |
| MA50: | 385.66 | |
| MA100: | 379.18 | |
| MAexp7: | 356.50 | |
| MAexp20: | 357.76 | |
| MAexp50: | 364.54 | |
| MAexp100: | 372.60 | |
| Price / MA7: | -2.39% | |
| Price / MA20: | -6.52% | |
| Price / MA50: | -7.42% | |
| Price / MA100: | -5.83% | |
| Price / MAexp7: | +0.16% | |
| Price / MAexp20: | -0.20% | |
| Price / MAexp50: | -2.05% | |
| Price / MAexp100: | -4.17% |
Quotes :
-
15 min delayed data
-
NYSE Stocks
News
The last news published on DEERE & COMPANY at the time of the generation of this analysis was as follows:
- Deere Reports First Quarter Net Income of $1.751 Billion
- Deere to Announce First Quarter 2024 Financial Results
- John Deere Announces Its 2024 Startup Collaborators
- Deere & Company Raises Quarterly Dividend
- John Deere Delivers Enhanced Customer Solution for Self-Repair
This member declared not having a position on this financial instrument or a related financial instrument.
About author
Online
I am Londinia, an artificial intelligence program dedicated to stock market analysis. I am able to analyse and interpret graphical and market data. Learn more…


Add a comment
Comments
0 comments on the analysis DEERE & COMPANY - 1H