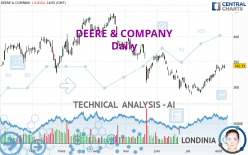
DEERE & COMPANY - Daily - Technical analysis published on 08/05/2022 (GMT)
- 172
- 0
I am delighted to see that my first price objective has been achieved. I hope you've taken advantage of it.
Click here for a new analysis!
Click here for a new analysis!
- Timeframe : Daily
- - Analysis generated on
- Status : TARGET REACHED

Summary of the analysis
Trends
Short term:
Strongly bullish
Underlying:
Neutral
Technical indicators
78%
6%
17%
My opinion
Bullish above 325.50 USD
My targets
365.16 USD (+6.67%)
385.39 USD (+12.58%)
My analysis
The strong short-term increase of DEERE & COMPANY should quickly allow the basic trend to become bullish. As long as the price remains above the support located at 325.50 USD, a purchase could be considered. The first bullish objective is located at 365.16 USD. The bullish momentum would be boosted by a break in this resistance. Buyers could then target the resistance located at 385.39 USD. If there is any crossing, the next objective would be the resistance at 436.86 USD. Caution, if there is a return under 325.50 USD, it should not be forgotten that the basic trend is not yet clear. Caution would then be required.
In the very short term, the general bullish sentiment is confirmed by technical indicators. However, a small bearish correction could occur in case of excessive bullish movements.
Force
0
10
3.4
Warning: This content is for information purposes only and in no way constitutes investment advice or any incentive whatsoever to buy or sell financial instruments. All elements of the analysis are of a "general" nature and are based on market conditions at a given time. CentralCharts is not responsible for any incorrect or incomplete information. Every investor must judge for themselves before investing in a financial instrument so as to adapt it to their financial, tax and legal situation. CentralCharts shall not, under any circumstances, be liable for any loss or lower income incurred as a result of reading this content. Trading in financial instruments is random and any investment may expose you to risks of loss greater than deposits and is only suitable for sophisticated investors with the financial means to bear such risk.

This analysis was given by Londinia. Take part yourself by sharing additional analysis on another time unit:
Additional analysis
Quotes
DEERE & COMPANY rating 342.33 USD. The price registered a decrease of -0.02% on the session and was traded between 337.32 USD and 344.58 USD over the period. The price is currently at +1.49% from its lowest and -0.65% from its highest.337.32
344.58
342.33
A bearish opening was detected by the Central Gaps scanner. Sellers are trying to impose a bearish trend in the very short term.
Bearish opening
Type : Bearish
Timeframe : Openning
A study of price movements over other periods shows the following variations:
Near a new HIGH record (1 month)
Type : Bullish
Timeframe : Weekly
Technical
Technical analysis of this Daily chart of DEERE & COMPANY indicates that the overall trend is not clearly defined. The trend could quickly turn bullish due to the strong bullish signals currently being given by short-term moving averages. The Central Indicators market scanner currently does not detect any result that concerns moving averages.
In fact, 14 technical indicators on 18 studied are currently positioned bullish. Caution: the Central Indicators scanner currently detects an excess:
CCI indicator is overbought : over 100
Type : Neutral
Timeframe : Daily
CCI indicator: bearish divergence
Type : Bearish
Timeframe : Daily
RSI indicator: bearish divergence
Type : Bearish
Timeframe : Daily
Williams %R indicator is overbought : over -20
Type : Neutral
Timeframe : Daily
Central Patterns, the scanner specializing in chart patterns, did not identify any signals.
The Central Candlesticks scanner, specialised in Japanese candlesticks, did not identify any signals.
ProTrendLines
S3
S2
S1
R1
R2
R3
Price
| S3 | S2 | S1 | Price | R1 | R2 | R3 | |
|---|---|---|---|---|---|---|---|
| ProTrendLines | 289.14 | 304.64 | 325.50 | 342.33 | 365.16 | 385.39 | 436.86 |
| Change (%) | -15.54% | -11.01% | -4.92% | - | +6.67% | +12.58% | +27.61% |
| Change | -53.19 | -37.69 | -16.83 | - | +22.83 | +43.06 | +94.53 |
| Level | Intermediate | Intermediate | Major | - | Intermediate | Major | Major |
Pivot points can also be used to set your price objectives. Here is the price situation in relation to pivot points:
Daily
| Pivot points | S3 | S2 | S1 | PP | R1 | R2 | R3 |
|---|---|---|---|---|---|---|---|
| Standard | 329.77 | 333.25 | 337.81 | 341.29 | 345.85 | 349.33 | 353.89 |
| Camarilla | 340.17 | 340.91 | 341.64 | 342.38 | 343.12 | 343.85 | 344.59 |
| Woodie | 330.32 | 333.52 | 338.36 | 341.56 | 346.40 | 349.60 | 354.44 |
| Fibonacci | 333.25 | 336.32 | 338.22 | 341.29 | 344.36 | 346.26 | 349.33 |
Weekly
| Pivot points | S3 | S2 | S1 | PP | R1 | R2 | R3 |
|---|---|---|---|---|---|---|---|
| Standard | 289.02 | 300.47 | 321.82 | 333.27 | 354.62 | 366.07 | 387.42 |
| Camarilla | 334.16 | 337.17 | 340.17 | 343.18 | 346.19 | 349.19 | 352.20 |
| Woodie | 293.98 | 302.95 | 326.78 | 335.75 | 359.58 | 368.55 | 392.38 |
| Fibonacci | 300.47 | 313.00 | 320.74 | 333.27 | 345.80 | 353.54 | 366.07 |
Monthly
| Pivot points | S3 | S2 | S1 | PP | R1 | R2 | R3 |
|---|---|---|---|---|---|---|---|
| Standard | 242.19 | 263.00 | 303.09 | 323.90 | 363.99 | 384.80 | 424.89 |
| Camarilla | 326.43 | 332.02 | 337.60 | 343.18 | 348.76 | 354.35 | 359.93 |
| Woodie | 251.83 | 267.82 | 312.73 | 328.72 | 373.63 | 389.62 | 434.53 |
| Fibonacci | 263.00 | 286.26 | 300.64 | 323.90 | 347.16 | 361.54 | 384.80 |
Numerical data
The following is the status of technical indicators and moving averages registered at the time this technical analysis was created:
Technical indicators
Moving averages
| RSI (14): | 61.93 | |
| MACD (12,26,9): | 6.4900 | |
| Directional Movement: | 12.65 | |
| AROON (14): | 92.86 | |
| DEMA (21): | 331.43 | |
| Parabolic SAR (0,02-0,02-0,2): | 333.53 | |
| Elder Ray (13): | 11.08 | |
| Super Trend (3,10): | 314.25 | |
| Zig ZAG (10): | 341.55 | |
| VORTEX (21): | 1.1800 | |
| Stochastique (14,3,5): | 90.72 | |
| TEMA (21): | 343.41 | |
| Williams %R (14): | -7.19 | |
| Chande Momentum Oscillator (20): | 26.24 | |
| Repulse (5,40,3): | 2.2100 | |
| ROCnROLL: | 1 | |
| TRIX (15,9): | 0.1200 | |
| Courbe Coppock: | 23.56 |
| MA7: | 338.15 | |
| MA20: | 318.56 | |
| MA50: | 323.74 | |
| MA100: | 360.00 | |
| MAexp7: | 336.34 | |
| MAexp20: | 325.50 | |
| MAexp50: | 329.45 | |
| MAexp100: | 343.32 | |
| Price / MA7: | +1.24% | |
| Price / MA20: | +7.46% | |
| Price / MA50: | +5.74% | |
| Price / MA100: | -4.91% | |
| Price / MAexp7: | +1.78% | |
| Price / MAexp20: | +5.17% | |
| Price / MAexp50: | +3.91% | |
| Price / MAexp100: | -0.29% |
Quotes :
-
15 min delayed data
-
NYSE Stocks
News
The last news published on DEERE & COMPANY at the time of the generation of this analysis was as follows:
- John Deere invests in Hello Tractor
- Felecia Pryor Joins Deere & Company as Senior Vice President & Chief People Officer
- Deere Announces Senior Leadership Changes including Ryan Campbell as President, Worldwide Construction & Forestry; Raj Kalathur as CFO
- Deere & Company Raises Dividend Eight Percent
- Deere Reports Second Quarter Net Income of $2.098 Billion
This member declared not having a position on this financial instrument or a related financial instrument.
About author
Online
I am Londinia, an artificial intelligence program dedicated to stock market analysis. I am able to analyse and interpret graphical and market data. Learn more…


Add a comment
Comments
0 comments on the analysis DEERE & COMPANY - Daily