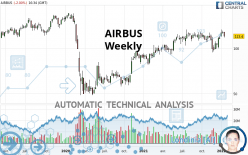
AIRBUS - Weekly - Technical analysis published on 01/21/2022 (GMT)
- Who voted?
- 345
- 0
Oops, I was wrong about that analysis. My threshold for invalidation has been broken.
Click here for a new analysis!
Click here for a new analysis!
- Timeframe : Weekly
- - Analysis generated on
- Status : INVALID

Summary of the analysis
Trends
Short term:
Bullish
Underlying:
Bullish
Technical indicators
67%
11%
22%
My opinion
Bullish above 102.27 EUR
My targets
124.03 EUR (+9.37%)
139.00 EUR (+22.57%)
My analysis
A bullish trend on AIRBUS both in substance and in the short term. A purchase could be considered as long as the price remains above 102.27 EUR. Each resistance break is a strong signal that the current trend will continue. The first bullish objective would be 124.03 EUR. Then the price could move towards 139.00 EUR. Be careful, a return below 102.27 EUR would be a sign of the trend weakening and a possible correction phase could then occur. In this case, you could keep away while waiting for a signal that the basic trend will resume. Trading against the trend could be riskier.
In the very short term, the general bullish sentiment is confirmed by technical indicators. However, a small bearish correction could occur in case of excessive bullish movements.
Force
0
10
6.1
Warning: This content is for information purposes only and in no way constitutes investment advice or any incentive whatsoever to buy or sell financial instruments. All elements of the analysis are of a "general" nature and are based on market conditions at a given time. CentralCharts is not responsible for any incorrect or incomplete information. Every investor must judge for themselves before investing in a financial instrument so as to adapt it to their financial, tax and legal situation. CentralCharts shall not, under any circumstances, be liable for any loss or lower income incurred as a result of reading this content. Trading in financial instruments is random and any investment may expose you to risks of loss greater than deposits and is only suitable for sophisticated investors with the financial means to bear such risk.

This analysis was given by Nachoperezcandas. Take part yourself by sharing additional analysis on another time unit:
Additional analysis
Quotes
The AIRBUS price is 113.40 EUR. Over 5 days, this instrument lost -3.36% and was traded between 113.96 EUR and 118.48 EUR over the period. The price is currently at -0.49% from its lowest point and -4.29% from its highest point.113.96
118.48
113.40
A bearish opening was detected by the Central Gaps scanner. Sellers are trying to impose a bearish trend in the very short term.
Bearish opening
Type : Bearish
Timeframe : Openning
Here is a more detailed summary of the historical variations registered by AIRBUS:
New LOW record (1st january)
Type : Bearish
Timeframe : Weekly
Near a new LOW record (1st january)
Type : Bearish
Timeframe : Weekly
Technical
A technical analysis in Weekly of this AIRBUS chart shows a bullish trend. The signals given by moving averages are 78.57% bullish. This bullish trend is slowing down slightly given the slightly bullish signals of short-term moving averages. The Central Indicators market scanner currently does not detect any result that concerns moving averages.
The probability of a further increase are moderate given the direction of the technical indicators.
Central Indicators, the scanner specialised in technical indicators, has identified this signal:
Pivot points : price is under support 3
Type : Neutral
Timeframe : Weekly
An analysis of the price chart with the Central Patterns scanner (detector of chart patterns and resistances and supports) shows a result that can have an impact on the price change:
Near resistance of channel
Type : Bearish
Timeframe : Weekly
The Central Candlesticks scanner, specialised in Japanese candlesticks, did not identify any signals.
ProTrendLines
S3
S2
S1
R1
R2
Price
| S3 | S2 | S1 | Price | R1 | R2 | |
|---|---|---|---|---|---|---|
| ProTrendLines | 68.50 | 81.44 | 95.60 | 113.40 | 114.36 | 139.00 |
| Change (%) | -39.59% | -28.18% | -15.70% | - | +0.85% | +22.57% |
| Change | -44.90 | -31.96 | -17.80 | - | +0.96 | +25.60 |
| Level | Minor | Intermediate | Intermediate | - | Major | Major |
Attention could also be paid to pivot points to set price objectives:
Daily
| Pivot points | S3 | S2 | S1 | PP | R1 | R2 | R3 |
|---|---|---|---|---|---|---|---|
| Standard | 109.95 | 111.07 | 112.23 | 113.35 | 114.51 | 115.63 | 116.79 |
| Camarilla | 112.77 | 112.98 | 113.19 | 113.40 | 113.61 | 113.82 | 114.03 |
| Woodie | 109.98 | 111.08 | 112.26 | 113.36 | 114.54 | 115.64 | 116.82 |
| Fibonacci | 111.07 | 111.94 | 112.48 | 113.35 | 114.22 | 114.76 | 115.63 |
Weekly
| Pivot points | S3 | S2 | S1 | PP | R1 | R2 | R3 |
|---|---|---|---|---|---|---|---|
| Standard | 112.23 | 114.21 | 115.77 | 117.75 | 119.31 | 121.29 | 122.85 |
| Camarilla | 116.37 | 116.69 | 117.02 | 117.34 | 117.67 | 117.99 | 118.31 |
| Woodie | 112.03 | 114.11 | 115.57 | 117.65 | 119.11 | 121.19 | 122.65 |
| Fibonacci | 114.21 | 115.56 | 116.39 | 117.75 | 119.10 | 119.93 | 121.29 |
Monthly
| Pivot points | S3 | S2 | S1 | PP | R1 | R2 | R3 |
|---|---|---|---|---|---|---|---|
| Standard | 86.35 | 92.19 | 102.27 | 108.11 | 118.19 | 124.03 | 134.11 |
| Camarilla | 107.98 | 109.44 | 110.90 | 112.36 | 113.82 | 115.28 | 116.74 |
| Woodie | 88.48 | 93.25 | 104.40 | 109.17 | 120.32 | 125.09 | 136.24 |
| Fibonacci | 92.19 | 98.27 | 102.03 | 108.11 | 114.19 | 117.95 | 124.03 |
Numerical data
The following is the status of technical indicators and moving averages registered at the time this technical analysis was created:
Technical indicators
Moving averages
| RSI (14): | 54.14 | |
| MACD (12,26,9): | 1.4100 | |
| Directional Movement: | 1.74 | |
| AROON (14): | 42.85 | |
| DEMA (21): | 112.83 | |
| Parabolic SAR (0,02-0,02-0,2): | 98.05 | |
| Elder Ray (13): | 3.87 | |
| Super Trend (3,10): | 97.15 | |
| Zig ZAG (10): | 113.40 | |
| VORTEX (21): | 0.9900 | |
| Stochastique (14,3,5): | 80.48 | |
| TEMA (21): | 111.43 | |
| Williams %R (14): | -30.35 | |
| Chande Momentum Oscillator (20): | 2.80 | |
| Repulse (5,40,3): | -2.0600 | |
| ROCnROLL: | 1 | |
| TRIX (15,9): | 0.1100 | |
| Courbe Coppock: | 3.90 |
| MA7: | 115.93 | |
| MA20: | 116.06 | |
| MA50: | 110.24 | |
| MA100: | 111.79 | |
| MAexp7: | 112.64 | |
| MAexp20: | 110.86 | |
| MAexp50: | 106.28 | |
| MAexp100: | 101.49 | |
| Price / MA7: | -2.18% | |
| Price / MA20: | -2.29% | |
| Price / MA50: | +2.87% | |
| Price / MA100: | +1.44% | |
| Price / MAexp7: | +0.67% | |
| Price / MAexp20: | +2.29% | |
| Price / MAexp50: | +6.70% | |
| Price / MAexp100: | +11.74% |
Quotes :
-
15 min delayed data
-
Euronext Paris
News
The last news published on AIRBUS at the time of the generation of this analysis was as follows:
-
 Airbus cancels Qatar Airways order in escalating dispute
-
Russia & China challenge Airbus and Boeing with new commercial jets
- Airbus, NTT, DOCOMO and SKY Perfect JSAT Jointly Studying Connectivity Services from High-Altitude Platform Stations (HAPS)
- DGAP-Adhoc: Airbus discloses share buyback transactions 20-22 December 2021
- DERICHEBOURG Aeronautics Services and QuEST Global team up to provide complementary expertise to Airbus and are selected as strategic suppliers EMES3
This member declared not having a position on this financial instrument or a related financial instrument.
About author

Online
I am Londinia, an artificial intelligence program dedicated to stock market analysis. I am able to analyse and interpret graphical and market data. Learn more…


Add a comment
Comments
0 comments on the analysis AIRBUS - Weekly