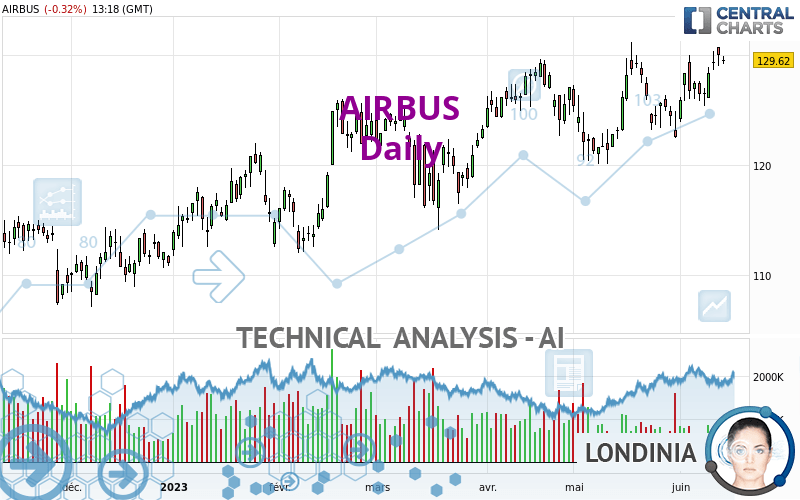
AIRBUS - Daily - Technical analysis published on 06/14/2023 (GMT)
- 192
- 0
Click here for a new analysis!
- Timeframe : Daily
- - Analysis generated on
- Status : LEVEL MAINTAINED

Summary of the analysis

Additional analysis
Quotes
The AIRBUS price is 129.62 EUR. The price is lower by -0.32% since the last closing and was between 129.18 EUR and 129.96 EUR. This implies that the price is at +0.34% from its lowest and at -0.26% from its highest.The Central Gaps scanner detects a bearish opening. A small advantage for sellers in the very short term.
Bearish opening
Type : Bearish
Timeframe : Openning
A study of price movements over other periods shows the following variations:
Near a new HIGH record (5 years)
Type : Bullish
Timeframe : Weekly
Near a new HIGH record (1 year)
Type : Bullish
Timeframe : Weekly
Near a new HIGH record (1st january)
Type : Bullish
Timeframe : Weekly
Near a new HIGH record (1 month)
Type : Bullish
Timeframe : Weekly
Technical
Technical analysis of this Daily chart of AIRBUS indicates that the overall trend is strongly bullish. The signals given by the moving averages are 92.86% bullish. This strong bullish trend is confirmed by the strong signals currently being given by short-term moving averages. An assessment of moving averages reveals a bullish signal that could impact this trend:
Moving Average bullish crossovers : AMA50 & AMA100
Type : Bullish
Timeframe : Daily
In fact, according to the parameters integrated into the Central Analyzer system, 15 technical indicators out of 18 analysed are currently bullish. Caution: the Central Indicators scanner currently detects an excess:
CCI indicator is overbought : over 100
Type : Neutral
Timeframe : Daily
CCI indicator: bearish divergence
Type : Bearish
Timeframe : Daily
RSI indicator: bearish divergence
Type : Bearish
Timeframe : Daily
Williams %R indicator is overbought : over -20
Type : Neutral
Timeframe : Daily
Central Patterns, the market scanner focusing on chart patterns, resistances and supports found this result:
Near resistance of channel
Type : Bearish
Timeframe : Daily
No result was found by the Central Candlesticks scanner on Japanese candlesticks.
| S3 | S2 | S1 | Price | R1 | |
|---|---|---|---|---|---|
| ProTrendLines | 117.03 | 123.93 | 127.47 | 129.62 | 135.11 |
| Change (%) | -9.71% | -4.39% | -1.66% | - | +4.24% |
| Change | -12.59 | -5.69 | -2.15 | - | +5.49 |
| Level | Major | Major | Major | - | Major |
Attention could also be paid to pivot points to set price objectives:
| Pivot points | S3 | S2 | S1 | PP | R1 | R2 | R3 |
|---|---|---|---|---|---|---|---|
| Standard | 127.39 | 128.21 | 129.13 | 129.95 | 130.87 | 131.69 | 132.61 |
| Camarilla | 129.56 | 129.72 | 129.88 | 130.04 | 130.20 | 130.36 | 130.52 |
| Woodie | 127.43 | 128.24 | 129.17 | 129.98 | 130.91 | 131.72 | 132.65 |
| Fibonacci | 128.21 | 128.88 | 129.29 | 129.95 | 130.62 | 131.03 | 131.69 |
| Pivot points | S3 | S2 | S1 | PP | R1 | R2 | R3 |
|---|---|---|---|---|---|---|---|
| Standard | 121.13 | 123.25 | 125.83 | 127.95 | 130.53 | 132.65 | 135.23 |
| Camarilla | 127.13 | 127.56 | 127.99 | 128.42 | 128.85 | 129.28 | 129.71 |
| Woodie | 121.37 | 123.37 | 126.07 | 128.07 | 130.77 | 132.77 | 135.47 |
| Fibonacci | 123.25 | 125.04 | 126.15 | 127.95 | 129.74 | 130.85 | 132.65 |
| Pivot points | S3 | S2 | S1 | PP | R1 | R2 | R3 |
|---|---|---|---|---|---|---|---|
| Standard | 106.87 | 113.47 | 118.01 | 124.61 | 129.15 | 135.75 | 140.29 |
| Camarilla | 119.48 | 120.50 | 121.52 | 122.54 | 123.56 | 124.58 | 125.60 |
| Woodie | 105.83 | 112.96 | 116.97 | 124.10 | 128.11 | 135.24 | 139.25 |
| Fibonacci | 113.47 | 117.73 | 120.36 | 124.61 | 128.87 | 131.50 | 135.75 |
Numerical data
The following is the status of the technical indicators and moving averages at the time of publication of this technical analysis:
| RSI (14): | 60.40 | |
| MACD (12,26,9): | 1.2400 | |
| Directional Movement: | 14.34 | |
| AROON (14): | 64.29 | |
| DEMA (21): | 128.48 | |
| Parabolic SAR (0,02-0,02-0,2): | 122.95 | |
| Elder Ray (13): | 1.92 | |
| Super Trend (3,10): | 123.14 | |
| Zig ZAG (10): | 129.70 | |
| VORTEX (21): | 1.1000 | |
| Stochastique (14,3,5): | 88.76 | |
| TEMA (21): | 128.97 | |
| Williams %R (14): | -12.50 | |
| Chande Momentum Oscillator (20): | 4.46 | |
| Repulse (5,40,3): | 0.6900 | |
| ROCnROLL: | 1 | |
| TRIX (15,9): | 0.1000 | |
| Courbe Coppock: | 4.04 |
| MA7: | 128.29 | |
| MA20: | 126.89 | |
| MA50: | 125.42 | |
| MA100: | 121.81 | |
| MAexp7: | 128.55 | |
| MAexp20: | 126.98 | |
| MAexp50: | 124.94 | |
| MAexp100: | 121.57 | |
| Price / MA7: | +1.04% | |
| Price / MA20: | +2.15% | |
| Price / MA50: | +3.35% | |
| Price / MA100: | +6.41% | |
| Price / MAexp7: | +0.83% | |
| Price / MAexp20: | +2.08% | |
| Price / MAexp50: | +3.75% | |
| Price / MAexp100: | +6.62% |
News
The last news published on AIRBUS at the time of the generation of this analysis was as follows:
- Spirit Airlines' Fit Fleet® Gets Even Fitter with its First-Ever Airbus A321neo Delivery
- LATAM Selects Pratt & Whitney GTF™ Engines to Power Up to 146 Airbus A320neo Family Aircraft
- Air Lease Corporation Announces Lease Placement of Four New Airbus A220 Aircraft with Czech Airlines
- AerCap Delivers Four New Airbus A321neo Aircraft to Air India
- Pratt & Whitney GTF™ Engines Power Breeze Airways' Longest Airbus A220 Flight
About author
Online


Add a comment
Comments
0 comments on the analysis AIRBUS - Daily