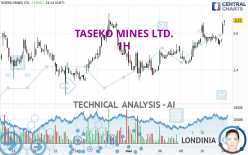
TASEKO MINES LTD. - 1H - Technical analysis published on 05/14/2024 (GMT)
- 75
- 0
Click here for a new analysis!
- Timeframe : 1H
- - Analysis generated on
- Status : TARGET REACHED

Summary of the analysis

Additional analysis
Quotes
TASEKO MINES LTD. rating 2.65 USD. On the day, this instrument gained +3.11% and was traded between 2.59 USD and 2.66 USD over the period. The price is currently at +2.32% from its lowest and -0.38% from its highest.The Central Gaps scanner detects the formation of a bullish gap marking the strong presence of buyers against sellers at the opening. This formed a quotation gap.
Opening Gap UP
Type : Bullish
Timeframe : Openning
Here is a more detailed summary of the historical variations registered by TASEKO MINES LTD.:
Near a new HIGH record (5 years)
Type : Bullish
Timeframe : Weekly
Near a new HIGH record (1 year)
Type : Bullish
Timeframe : Weekly
Near a new HIGH record (1st january)
Type : Bullish
Timeframe : Weekly
Near a new HIGH record (1 month)
Type : Bullish
Timeframe : Weekly
Abnormal volumes on TASEKO MINES LTD. were detected by the Central Volumes scanner:
Abnormal volumes
Timeframe : 20 days
Abnormal volumes
Timeframe : 50 days
Technical
Technical analysis of this 1H chart of TASEKO MINES LTD. indicates that the overall trend is strongly bullish. The signals given by the moving averages are 92.86% bullish. This strong bullish trend is confirmed by the strong signals currently being given by short-term moving averages. An assessment of moving averages reveals a bullish signal that could impact this trend:
Bullish price crossover with Moving Average 20
Type : Bullish
Timeframe : 1 hour
In fact, 13 technical indicators on 18 studied are currently positioned bullish. But beware of excesses. The Central Indicators scanner currently detects this:
CCI indicator is overbought : over 100
Type : Neutral
Timeframe : 1 hour
Williams %R indicator is overbought : over -20
Type : Neutral
Timeframe : 1 hour
Pivot points : price is over resistance 2
Type : Neutral
Timeframe : 1 hour
Momentum indicator is back over 0
Type : Bullish
Timeframe : 1 hour
The Central Patterns scanner, which studies chart patterns, resistances and supports, has identified these signals:
Near horizontal resistance
Type : Bearish
Timeframe : 1 hour
Resistance of channel is broken
Type : Bullish
Timeframe : 1 hour
Central Candlesticks, the scanner specialised in Japanese candlesticks, detects a bullish signal that could support the hypothesis of a small rebound in the very short term:
Upside gap
Type : Bullish
Timeframe : 1 hour
| S3 | S2 | S1 | Price | R1 | R2 | R3 | |
|---|---|---|---|---|---|---|---|
| ProTrendLines | 2.54 | 2.58 | 2.62 | 2.65 | 2.66 | 2.71 | 3.51 |
| Change (%) | -4.15% | -2.64% | -1.13% | - | +0.38% | +2.26% | +32.45% |
| Change | -0.11 | -0.07 | -0.03 | - | +0.01 | +0.06 | +0.86 |
| Level | Minor | Intermediate | Major | - | Minor | Minor | Minor |
Pivot points can also be used to set your price objectives. Here is the price situation in relation to pivot points:
| Pivot points | S3 | S2 | S1 | PP | R1 | R2 | R3 |
|---|---|---|---|---|---|---|---|
| Standard | 2.46 | 2.50 | 2.53 | 2.57 | 2.60 | 2.64 | 2.67 |
| Camarilla | 2.55 | 2.56 | 2.56 | 2.57 | 2.58 | 2.58 | 2.59 |
| Woodie | 2.47 | 2.50 | 2.54 | 2.57 | 2.61 | 2.64 | 2.68 |
| Fibonacci | 2.50 | 2.52 | 2.54 | 2.57 | 2.59 | 2.61 | 2.64 |
| Pivot points | S3 | S2 | S1 | PP | R1 | R2 | R3 |
|---|---|---|---|---|---|---|---|
| Standard | 2.19 | 2.30 | 2.43 | 2.54 | 2.67 | 2.78 | 2.91 |
| Camarilla | 2.48 | 2.51 | 2.53 | 2.55 | 2.57 | 2.59 | 2.62 |
| Woodie | 2.19 | 2.31 | 2.43 | 2.55 | 2.67 | 2.79 | 2.91 |
| Fibonacci | 2.30 | 2.40 | 2.45 | 2.54 | 2.64 | 2.69 | 2.78 |
| Pivot points | S3 | S2 | S1 | PP | R1 | R2 | R3 |
|---|---|---|---|---|---|---|---|
| Standard | 1.59 | 1.87 | 2.16 | 2.44 | 2.73 | 3.01 | 3.30 |
| Camarilla | 2.30 | 2.36 | 2.41 | 2.46 | 2.51 | 2.57 | 2.62 |
| Woodie | 1.61 | 1.87 | 2.18 | 2.44 | 2.75 | 3.01 | 3.32 |
| Fibonacci | 1.87 | 2.08 | 2.22 | 2.44 | 2.65 | 2.79 | 3.01 |
Numerical data
The following are the details of the technical indicators and moving averages that were collected to generate this technical analysis:
| RSI (14): | 67.45 | |
| MACD (12,26,9): | 0.0200 | |
| Directional Movement: | 19.06 | |
| AROON (14): | -78.57 | |
| DEMA (21): | 2.59 | |
| Parabolic SAR (0,02-0,02-0,2): | 2.53 | |
| Elder Ray (13): | 0.06 | |
| Super Trend (3,10): | 2.51 | |
| Zig ZAG (10): | 2.65 | |
| VORTEX (21): | 1.1000 | |
| Stochastique (14,3,5): | 43.59 | |
| TEMA (21): | 2.59 | |
| Williams %R (14): | -7.69 | |
| Chande Momentum Oscillator (20): | 0.08 | |
| Repulse (5,40,3): | 3.2400 | |
| ROCnROLL: | 1 | |
| TRIX (15,9): | 0.1400 | |
| Courbe Coppock: | 1.30 |
| MA7: | 2.55 | |
| MA20: | 2.48 | |
| MA50: | 2.26 | |
| MA100: | 1.85 | |
| MAexp7: | 2.60 | |
| MAexp20: | 2.56 | |
| MAexp50: | 2.52 | |
| MAexp100: | 2.49 | |
| Price / MA7: | +3.92% | |
| Price / MA20: | +6.85% | |
| Price / MA50: | +17.26% | |
| Price / MA100: | +43.24% | |
| Price / MAexp7: | +1.92% | |
| Price / MAexp20: | +3.52% | |
| Price / MAexp50: | +5.16% | |
| Price / MAexp100: | +6.43% |
News
The latest news and videos published on TASEKO MINES LTD. at the time of the analysis were as follows:
- Taseko Mines Limited - Taseko Reports First Quarter 2024 Operational Performance and $50 Million of Adjusted EBITDA
- Taseko Reports First Quarter 2024 Operational Performance and $50 Million of Adjusted EBITDA
- Taseko Mines Limited - Taseko Mines Completes Notes Offering
- TASEKO MINES COMPLETES NOTES OFFERING
- Taseko Mines Limited - Taseko Announces Pricing of SR Secured Notes
About author
Online


Add a comment
Comments
0 comments on the analysis TASEKO MINES LTD. - 1H