CARVANA CO. CLASS A - $CVNA: Car Retailer Carvana Entering Short Term Support Area - 10/30/2023 (GMT)
- 99
- 0
- Timeframe : Weekly
CARVANA CO. CLASS A Chart
Are you looking for opportunities in American stocks?
DISCOVER LONDINIA OPPORTUNITIES...
DISCOVER LONDINIA OPPORTUNITIES...
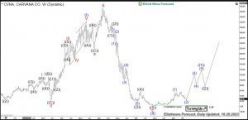
$CVNA Carvana Co. is an online used car retailer and is known for its multi-store car vending machines. Today, the company is the fastest growing online used car dealer in the United States. Recently, Carvana gained publicity as it was named to the 2021 Fortune 500 list, in fact, one of the youngest companies to be added to the list. Founded 2012 and headquartered in Tempe, Arizona, US, it is a part of Russel 1000 small-cap index. Investors can trade it under the ticker $CVNA at NYSE.In the initial article from June 2023, we have explained that long-term consolidation has ended and a new bullish cycle has started. In the current blog, we provide with a short term buying opportunity where investors and traders can join the rally.Carvana Weekly Elliott Wave Analysis 10.28.2023The weekly chart below shows the Carvana shares $CVNA traded at NYSE. From the lows, the stock price has developed an initial cycle higher in blue wave (I) of super cycle degree towards $323.39 highs in March 2021. Hereby, red wave III shows an extension beyond 1.618 multiples of the red wave I. From the March 2021 highs, a correction lower in blue wave (II) has unfolded as an Elliott wave expanded flat pattern being 3-3-5 structure.Firstly, 3 swings in red wave a of blue wave (II) have printed a low at $222.79 in May 2021. Then, a bounce has set a connector wave b at $376.83 new all-time highs in August 2021. Later on, the price has broken 222.79 lows. Red wave c shows hereby a series of nests and an acceleration lower in blue wave (3) of black wave ((3)) of red wave c. It is the the preferred view that the correction in blue wave (II) has ended in December 2022 at $3.55 lows. As a matter of fact, $CVNA has broken the descending price and RSI trendlines from the all-time highs to the upside. While above December 2022 lows, a new bullish cycle in blue wave (III) might have started. The target for the wave (III) is 327-527 area and even beyond.
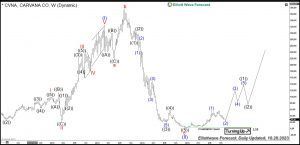
Carvana Daily Elliott Wave Analysis 10.28.2022The Daily chart below shows in more detail the initial stages of the blue wave (III). From the December 2022 lows at $3.55, blue wave (1) shows 5 fully developed subwaves 1-2-3-4-5 of red degree. Blue wave (1) has ended in July 2023 at 57.19 highs. Hereby, red wave 3 has reached beyond 2.0x of the wave 1.From 57.19 highs, a pullback in blue wave (2) is in progress. It unfolds as a 3-3-5 regular flat pattern. Firstly, 3 swings of A have set a low in August 2023 at $36.42. Then, bounce in 3 swings of red B has set a connector in September 2023 at $56.80. Now, the prices have broken 36.42 lows. As a consequence, it has created a bearish sequence. $CVNA stock has reached within red wave C the 100% extension range being 36.00-23.12 area. It can still extend lower to end blue wave (2). Soon, reaction higher in blue wave (3) should take place.Investors and traders can buy $CVNA from 36.00-23.12 bluebox targeting 77-110 area in the medium-term and 327-527 area in the long run.
Carvana Daily Elliott Wave Analysis 10.28.2022The Daily chart below shows in more detail the initial stages of the blue wave (III). From the December 2022 lows at $3.55, blue wave (1) shows 5 fully developed subwaves 1-2-3-4-5 of red degree. Blue wave (1) has ended in July 2023 at 57.19 highs. Hereby, red wave 3 has reached beyond 2.0x of the wave 1.From 57.19 highs, a pullback in blue wave (2) is in progress. It unfolds as a 3-3-5 regular flat pattern. Firstly, 3 swings of A have set a low in August 2023 at $36.42. Then, bounce in 3 swings of red B has set a connector in September 2023 at $56.80. Now, the prices have broken 36.42 lows. As a consequence, it has created a bearish sequence. $CVNA stock has reached within red wave C the 100% extension range being 36.00-23.12 area. It can still extend lower to end blue wave (2). Soon, reaction higher in blue wave (3) should take place.Investors and traders can buy $CVNA from 36.00-23.12 bluebox targeting 77-110 area in the medium-term and 327-527 area in the long run.
This member declared not having a position on this financial instrument or a related financial instrument.
About author

Offline


Add a comment
Comments
0 comments on the analysis CARVANA CO. CLASS A - Weekly