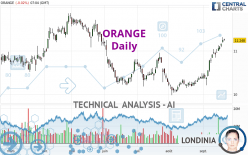
ORANGE - Daily - Technical analysis published on 09/21/2023 (GMT)
- 180
- 0
Click here for a new analysis!
- Timeframe : Daily
- - Analysis generated on
- Status : INVALID

Summary of the analysis

Additional analysis
Quotes
ORANGE rating 11.248 EUR. The price is lower by -0.02% since the last closing and was traded between 11.242 EUR and 11.282 EUR over the period. The price is currently at +0.05% from its lowest and -0.30% from its highest.The Central Gaps scanner detects the formation of a bullish gap marking the strong presence of buyers against sellers at the opening. This formed a quotation gap.
Opening Gap UP
Type : Bullish
Timeframe : Openning
So that you have an overall view of the price change, here is a table showing the variations over several periods:
Near a new HIGH record (1 year)
Type : Bullish
Timeframe : Weekly
Near a new HIGH record (1st january)
Type : Bullish
Timeframe : Weekly
New HIGH record (1 month)
Type : Bullish
Timeframe : Weekly
Technical
Technical analysis of this Daily chart of ORANGE indicates that the overall trend is bullish. 78.57% of the signals given by moving averages are bullish. This bullish trend is supported by the strong bullish signals given by short-term moving averages. The Central Indicators market scanner currently does not detect any result that concerns moving averages.
An assessment of technical indicators shows a strong bullish signal.
Caution: the Central Indicators scanner currently detects an excess:
RSI indicator is overbought : over 80
Type : Neutral
Timeframe : Daily
CCI indicator is overbought : over 100
Type : Neutral
Timeframe : Daily
Williams %R indicator is overbought : over -20
Type : Neutral
Timeframe : Daily
Pivot points : price is over resistance 1
Type : Neutral
Timeframe : Weekly
Pivot points : price is over resistance 2
Type : Neutral
Timeframe : Daily
An analysis of the price chart with the Central Patterns scanner (detector of chart patterns and resistances and supports) shows several results that can have an impact on the price change:
Near horizontal resistance
Type : Bearish
Timeframe : Daily
Resistance of channel is broken
Type : Bullish
Timeframe : Daily
The presence of a bullish Japanese candlestick pattern detected by Central Candlesticks that could cause a very short term rebound was also detected:
Upside gap
Type : Bullish
Timeframe : Daily
| S3 | S2 | S1 | Price | R1 | R2 | |
|---|---|---|---|---|---|---|
| ProTrendLines | 10.321 | 10.641 | 10.857 | 11.248 | 11.386 | 11.882 |
| Change (%) | -8.24% | -5.40% | -3.48% | - | +1.23% | +5.64% |
| Change | -0.927 | -0.607 | -0.391 | - | +0.138 | +0.634 |
| Level | Intermediate | Major | Major | - | Major | Minor |
Pivot points can also be used to set your price objectives. Here is the price situation in relation to pivot points:
| Pivot points | S3 | S2 | S1 | PP | R1 | R2 | R3 |
|---|---|---|---|---|---|---|---|
| Standard | 11.063 | 11.127 | 11.189 | 11.253 | 11.315 | 11.379 | 11.441 |
| Camarilla | 11.215 | 11.227 | 11.239 | 11.250 | 11.262 | 11.273 | 11.285 |
| Woodie | 11.061 | 11.127 | 11.187 | 11.253 | 11.313 | 11.379 | 11.439 |
| Fibonacci | 11.127 | 11.176 | 11.205 | 11.253 | 11.302 | 11.331 | 11.379 |
| Pivot points | S3 | S2 | S1 | PP | R1 | R2 | R3 |
|---|---|---|---|---|---|---|---|
| Standard | 10.595 | 10.717 | 10.889 | 11.011 | 11.183 | 11.305 | 11.477 |
| Camarilla | 10.979 | 11.006 | 11.033 | 11.060 | 11.087 | 11.114 | 11.141 |
| Woodie | 10.619 | 10.730 | 10.913 | 11.024 | 11.207 | 11.318 | 11.501 |
| Fibonacci | 10.717 | 10.830 | 10.899 | 11.011 | 11.124 | 11.193 | 11.305 |
| Pivot points | S3 | S2 | S1 | PP | R1 | R2 | R3 |
|---|---|---|---|---|---|---|---|
| Standard | 9.560 | 9.770 | 10.064 | 10.274 | 10.568 | 10.778 | 11.072 |
| Camarilla | 10.219 | 10.266 | 10.312 | 10.358 | 10.404 | 10.450 | 10.497 |
| Woodie | 9.602 | 9.791 | 10.106 | 10.295 | 10.610 | 10.799 | 11.114 |
| Fibonacci | 9.770 | 9.963 | 10.082 | 10.274 | 10.467 | 10.586 | 10.778 |
Numerical data
The following is the status of the technical indicators and moving averages at the time of publication of this technical analysis:
| RSI (14): | 82.85 | |
| MACD (12,26,9): | 0.2200 | |
| Directional Movement: | 32.028 | |
| AROON (14): | 78.571 | |
| DEMA (21): | 11.035 | |
| Parabolic SAR (0,02-0,02-0,2): | 10.765 | |
| Elder Ray (13): | 0.348 | |
| Super Trend (3,10): | 10.870 | |
| Zig ZAG (10): | 11.250 | |
| VORTEX (21): | 1.2950 | |
| Stochastique (14,3,5): | 96.72 | |
| TEMA (21): | 11.211 | |
| Williams %R (14): | -6.15 | |
| Chande Momentum Oscillator (20): | 0.866 | |
| Repulse (5,40,3): | 1.2820 | |
| ROCnROLL: | 1 | |
| TRIX (15,9): | 0.2160 | |
| Courbe Coppock: | 14.10 |
| MA7: | 11.063 | |
| MA20: | 10.680 | |
| MA50: | 10.485 | |
| MA100: | 10.606 | |
| MAexp7: | 11.061 | |
| MAexp20: | 10.781 | |
| MAexp50: | 10.594 | |
| MAexp100: | 10.509 | |
| Price / MA7: | +1.67% | |
| Price / MA20: | +5.32% | |
| Price / MA50: | +7.28% | |
| Price / MA100: | +6.05% | |
| Price / MAexp7: | +1.69% | |
| Price / MAexp20: | +4.33% | |
| Price / MAexp50: | +6.17% | |
| Price / MAexp100: | +7.03% |
News
The last news published on ORANGE at the time of the generation of this analysis was as follows:
- Total number of shares and voting rights at August 31, 2023
- Orange Capital to Vote FOR the Merger and Internalization Transaction at the GNL Special Meeting
- Orange Capital Issues Statement and Releases KEY Questions in Advance of Today's GNL Management Call
- Press release : Orange successfully completes its inaugural sustainability-linked bond issuance for EUR 500M
- Foresee Pharmaceuticals Announces FDA Orange Book Listing of New U.S. Patent for CAMCEVI®, Extending Patent Protection to 2039
About author
Online


Add a comment
Comments
0 comments on the analysis ORANGE - Daily