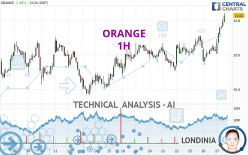
ORANGE - 1H - Technical analysis published on 03/27/2024 (GMT)
- 107
- 0
Click here for a new analysis!
- Timeframe : 1H
- - Analysis generated on
- Status : TARGET REACHED

Summary of the analysis

Additional analysis
Quotes
The ORANGE price is 10.814 EUR. The price has increased by +1.73% since the last closing and was between 10.608 EUR and 10.814 EUR. This implies that the price is at +1.94% from its lowest and at 0% from its highest.The Central Gaps scanner detects a bearish opening marking the presence of sellers ahead of buyers at the opening but not sufficiently marked to allow the price to register a quotation gap.
Bearish opening
Type : Bearish
Timeframe : Openning
A study of price movements over other periods shows the following variations:
Near a new LOW record (1st january)
Type : Bearish
Timeframe : Weekly
Near a new LOW record (1 month)
Type : Bearish
Timeframe : Weekly
Technical
Technical analysis of this 1H chart of ORANGE indicates that the overall trend is strongly bullish. 92.86% of the signals given by moving averages are bullish. The overall trend is supported by the strong bullish signals from short-term moving averages. There is no crossing of moving average by the price or crossing of moving averages between themselves.
Technical indicators are strongly bullish, suggesting that the price increase should continue.
Caution: the Central Indicators scanner currently detects an excess:
RSI indicator is overbought : over 70
Type : Neutral
Timeframe : 1 hour
CCI indicator is overbought : over 100
Type : Neutral
Timeframe : 1 hour
CCI indicator: bearish divergence
Type : Bearish
Timeframe : 1 hour
Williams %R indicator is overbought : over -20
Type : Neutral
Timeframe : 1 hour
Pivot points : price is over resistance 2
Type : Neutral
Timeframe : Weekly
Pivot points : price is over resistance 3
Type : Neutral
Timeframe : 1 hour
Central Patterns, the market scanner focusing on chart patterns, resistances and supports found these results:
Near horizontal resistance
Type : Bearish
Timeframe : 1 hour
Resistance of channel is broken
Type : Bullish
Timeframe : 1 hour
The Central Candlesticks scanner, specialised in Japanese candlesticks, did not identify any signals.
| S3 | S2 | S1 | Price | R1 | R2 | R3 | |
|---|---|---|---|---|---|---|---|
| ProTrendLines | 10.631 | 10.670 | 10.716 | 10.814 | 10.840 | 10.904 | 11.094 |
| Change (%) | -1.69% | -1.33% | -0.91% | - | +0.24% | +0.83% | +2.59% |
| Change | -0.183 | -0.144 | -0.098 | - | +0.026 | +0.090 | +0.280 |
| Level | Intermediate | Major | Minor | - | Minor | Intermediate | Major |
To determine price objectives, it is also possible to use the pivot points. Here is the price position in relation to pivot points:
| Pivot points | S3 | S2 | S1 | PP | R1 | R2 | R3 |
|---|---|---|---|---|---|---|---|
| Standard | 10.446 | 10.494 | 10.562 | 10.610 | 10.678 | 10.726 | 10.794 |
| Camarilla | 10.598 | 10.609 | 10.619 | 10.630 | 10.641 | 10.651 | 10.662 |
| Woodie | 10.456 | 10.499 | 10.572 | 10.615 | 10.688 | 10.731 | 10.804 |
| Fibonacci | 10.494 | 10.538 | 10.566 | 10.610 | 10.654 | 10.682 | 10.726 |
| Pivot points | S3 | S2 | S1 | PP | R1 | R2 | R3 |
|---|---|---|---|---|---|---|---|
| Standard | 10.317 | 10.397 | 10.509 | 10.589 | 10.701 | 10.781 | 10.893 |
| Camarilla | 10.567 | 10.585 | 10.602 | 10.620 | 10.638 | 10.655 | 10.673 |
| Woodie | 10.332 | 10.405 | 10.524 | 10.597 | 10.716 | 10.789 | 10.908 |
| Fibonacci | 10.397 | 10.471 | 10.516 | 10.589 | 10.663 | 10.708 | 10.781 |
| Pivot points | S3 | S2 | S1 | PP | R1 | R2 | R3 |
|---|---|---|---|---|---|---|---|
| Standard | 9.713 | 10.107 | 10.357 | 10.751 | 11.001 | 11.395 | 11.645 |
| Camarilla | 10.429 | 10.488 | 10.547 | 10.606 | 10.665 | 10.724 | 10.783 |
| Woodie | 9.640 | 10.071 | 10.284 | 10.715 | 10.928 | 11.359 | 11.572 |
| Fibonacci | 10.107 | 10.353 | 10.505 | 10.751 | 10.997 | 11.149 | 11.395 |
Numerical data
The following are the details of the technical indicators and moving averages that were collected to generate this technical analysis:
| RSI (14): | 73.42 | |
| MACD (12,26,9): | 0.0410 | |
| Directional Movement: | 26.000 | |
| AROON (14): | 85.714 | |
| DEMA (21): | 10.733 | |
| Parabolic SAR (0,02-0,02-0,2): | 10.604 | |
| Elder Ray (13): | 0.090 | |
| Super Trend (3,10): | 10.685 | |
| Zig ZAG (10): | 10.814 | |
| VORTEX (21): | 1.2220 | |
| Stochastique (14,3,5): | 96.73 | |
| TEMA (21): | 10.760 | |
| Williams %R (14): | -1.47 | |
| Chande Momentum Oscillator (20): | 0.204 | |
| Repulse (5,40,3): | 0.7500 | |
| ROCnROLL: | 1 | |
| TRIX (15,9): | 0.0280 | |
| Courbe Coppock: | 1.94 |
| MA7: | 10.637 | |
| MA20: | 10.573 | |
| MA50: | 10.761 | |
| MA100: | 10.762 | |
| MAexp7: | 10.747 | |
| MAexp20: | 10.687 | |
| MAexp50: | 10.642 | |
| MAexp100: | 10.617 | |
| Price / MA7: | +1.66% | |
| Price / MA20: | +2.28% | |
| Price / MA50: | +0.49% | |
| Price / MA100: | +0.48% | |
| Price / MAexp7: | +0.62% | |
| Price / MAexp20: | +1.19% | |
| Price / MAexp50: | +1.62% | |
| Price / MAexp100: | +1.86% |
News
The latest news and videos published on ORANGE at the time of the analysis were as follows:
- Press release: Orange and MASMOVIL complete transaction to form the leading operator in Spain in terms of customers
- Taste the Sweet Nostalgia: Wendy's Debuts Orange Dreamsicle Frosty
- Easing Access to Web3: Tucows, Hiro and Trust Machines Launch Orange Domains
- Press Release : Orange and BNP Paribas conclude their exclusive negotiations by signing several agreements
- SoDo Main Street District Receives United Arts Community Vibrancy Grant, Naming Orlando Credit Union as Community Partner to Support South Orange Avenue Businesses
About author
Online


Add a comment
Comments
0 comments on the analysis ORANGE - 1H