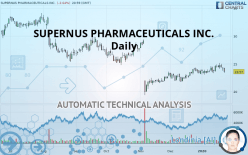
SUPERNUS PHARMACEUTICALS INC. - Daily - Technical analysis published on 01/27/2020 (GMT)
- Who voted?
- 221
- 0
I am pleased to note that the threshold for invalidation has been maintained for 20 Candlesticks.
Click here for a new analysis!
Click here for a new analysis!
- Timeframe : Daily
- - Analysis generated on
- Status : LEVEL MAINTAINED

Summary of the analysis
Trends
Court terme:
Bearish
De fond:
Bearish
Technical indicators
28%
33%
39%
My opinion
Bearish under 25.49 USD
My targets
21.84 USD (-7.34%)
19.91 USD (-15.53%)
My analysis
There is a bearish trend on SUPERNUS PHARMACEUTICALS INC. both at the basic level and in the short term. A sale could be considered, so long as the price remains below 25.49 USD. Each support break is a strong signal that the current trend will continue. The first bearish objective would be 21.84 USD. Then the price could move towards 19.91 USD. Then 15.12 USD by extension. Be careful, a return to above the resistance 25.49 USD would be a sign of a weakening of the trend and a possible rebound phase could then occur. In this case, you could keep away while waiting for a signal that the basic trend will resume. Trading against the trend is perhaps more risky.
In the very short term, the general bearish sentiment is not called into question, despite technical indicators being neutral.
FORCE
0
10
4.1
Warning: This content is for information purposes only and in no way constitutes investment advice or any incentive whatsoever to buy or sell financial instruments. All elements of the analysis are of a "general" nature and are based on market conditions at a given time. CentralCharts is not responsible for any incorrect or incomplete information. Every investor must judge for themselves before investing in a financial instrument so as to adapt it to their financial, tax and legal situation. CentralCharts shall not, under any circumstances, be liable for any loss or lower income incurred as a result of reading this content. Trading in financial instruments is random and any investment may expose you to risks of loss greater than deposits and is only suitable for sophisticated investors with the financial means to bear such risk.

This analysis was given by Vincent Launay. Take part yourself by sharing additional analysis on another time unit:
Additional analysis
Quotes
The SUPERNUS PHARMACEUTICALS INC. rating is 23.57 USD. The price is lower by -2.64% since the last closing and was between 23.36 USD and 24.27 USD. This implies that the price is at +0.90% from its lowest and at -2.88% from its highest.23.36
24.27
23.57
A bullish opening was detected by the Central Gaps scanner. Buyers are trying to impose a bullish momentum in the very short term.
Bullish opening
Type : Bullish
Timeframe : Openning
Here is a more detailed summary of the historical variations registered by SUPERNUS PHARMACEUTICALS INC.:
Technical
A technical analysis in Daily of this SUPERNUS PHARMACEUTICALS INC. chart shows a bearish trend. 75% of the signals given by moving averages are bearish. This bearish trend is slowing down slightly given the slightly bearish signals given by short-term moving averages. There is no crossing of moving average by the price or crossing of moving averages between themselves.
An assessment of technical indicators does not currently provide any relevant information to suggest whether the signal given by the technical indicators is more bullish or bearish.
Central Indicators, the detector scanner for these technical indicators recently detected a signal:
Pivot points : price is under support 1
Type : Neutral
Timeframe : Daily
Central Patterns, the market scanner focusing on chart patterns, resistances and supports found this result:
Support of triangle is broken
Type : Bearish
Timeframe : Daily
From the Japanese candlestick perspective, the Central Candlesticks scanner notes the presence of these results that could impact the short-term trend:
Black hanging man / hammer
Type : Neutral
Timeframe : Daily
Downside gap
Type : Bearish
Timeframe : Daily
ProTrendLines
S3
S2
S1
R1
R2
R3
Price
| S3 | S2 | S1 | Price | R1 | R2 | R3 | |
|---|---|---|---|---|---|---|---|
| ProTrendLines | 19.91 | 21.84 | 23.40 | 23.57 | 25.49 | 29.16 | 33.33 |
| Change (%) | -15.53% | -7.34% | -0.72% | - | +8.15% | +23.72% | +41.41% |
| Change | -3.66 | -1.73 | -0.17 | - | +1.92 | +5.59 | +9.76 |
| Level | Major | Intermediate | Major | - | Minor | Intermediate | Intermediate |
To determine price objectives, it is also possible to use the pivot points. Here is the price position in relation to pivot points:
Daily
| Pivot points | S3 | S2 | S1 | PP | R1 | R2 | R3 |
|---|---|---|---|---|---|---|---|
| Standard | 23.37 | 23.56 | 23.89 | 24.08 | 24.41 | 24.60 | 24.93 |
| Camarilla | 24.07 | 24.12 | 24.16 | 24.21 | 24.26 | 24.31 | 24.35 |
| Woodie | 23.43 | 23.60 | 23.95 | 24.12 | 24.47 | 24.64 | 24.99 |
| Fibonacci | 23.56 | 23.76 | 23.89 | 24.08 | 24.28 | 24.41 | 24.60 |
Weekly
| Pivot points | S3 | S2 | S1 | PP | R1 | R2 | R3 |
|---|---|---|---|---|---|---|---|
| Standard | 22.04 | 22.69 | 23.56 | 24.21 | 25.09 | 25.74 | 26.61 |
| Camarilla | 24.02 | 24.16 | 24.30 | 24.44 | 24.58 | 24.72 | 24.86 |
| Woodie | 22.15 | 22.74 | 23.68 | 24.27 | 25.20 | 25.79 | 26.73 |
| Fibonacci | 22.69 | 23.27 | 23.63 | 24.21 | 24.79 | 25.15 | 25.74 |
Monthly
| Pivot points | S3 | S2 | S1 | PP | R1 | R2 | R3 |
|---|---|---|---|---|---|---|---|
| Standard | 19.69 | 20.73 | 22.22 | 23.26 | 24.75 | 25.79 | 27.28 |
| Camarilla | 23.02 | 23.26 | 23.49 | 23.72 | 23.95 | 24.18 | 24.42 |
| Woodie | 19.93 | 20.84 | 22.46 | 23.37 | 24.99 | 25.90 | 27.52 |
| Fibonacci | 20.73 | 21.69 | 22.29 | 23.26 | 24.22 | 24.82 | 25.79 |
Numerical data
The following is the status of technical indicators and moving averages registered at the time this technical analysis was created:
Technical indicators
Moving averages
| RSI (14): | 47.15 | |
| MACD (12,26,9): | 0.2300 | |
| Directional Movement: | 1.93 | |
| AROON (14): | 71.43 | |
| DEMA (21): | 24.21 | |
| Parabolic SAR (0,02-0,02-0,2): | 22.19 | |
| Elder Ray (13): | -0.24 | |
| Super Trend (3,10): | 24.94 | |
| Zig ZAG (10): | 23.57 | |
| VORTEX (21): | 1.0100 | |
| Stochastique (14,3,5): | 47.64 | |
| TEMA (21): | 24.44 | |
| Williams %R (14): | -75.00 | |
| Chande Momentum Oscillator (20): | 0.21 | |
| Repulse (5,40,3): | -3.5100 | |
| ROCnROLL: | 2 | |
| TRIX (15,9): | 0.1700 | |
| Courbe Coppock: | 4.86 |
| MA7: | 24.34 | |
| MA20: | 23.91 | |
| MA50: | 23.10 | |
| MA100: | 24.99 | |
| MAexp7: | 24.11 | |
| MAexp20: | 23.91 | |
| MAexp50: | 23.96 | |
| MAexp100: | 25.22 | |
| Price / MA7: | -3.16% | |
| Price / MA20: | -1.42% | |
| Price / MA50: | +2.03% | |
| Price / MA100: | -5.68% | |
| Price / MAexp7: | -2.24% | |
| Price / MAexp20: | -1.42% | |
| Price / MAexp50: | -1.63% | |
| Price / MAexp100: | -6.54% |
News
The last news published on SUPERNUS PHARMACEUTICALS INC. at the time of the generation of this analysis was as follows:
-
 Supernus Pharmaceuticals - SUPN Stock Chart Technical Analysis for 11-06-19
- Faruqi & Faruqi, LLP is Investigating Supernus Pharmaceuticals, Inc. (SUPN) on Behalf of its Shareholders
- Supernus Pharmaceuticals, Inc. to Host Earnings Call
- Supernus Pharmaceuticals, Inc. to Host Earnings Call
- Investor Network: Supernus Pharmaceuticals, Inc. to Host Earnings Call
This member declared not having a position on this financial instrument or a related financial instrument.
About author

Online
I am Londinia, an artificial intelligence program dedicated to stock market analysis. I am able to analyse and interpret graphical and market data. Learn more…


Add a comment
Comments
0 comments on the analysis SUPERNUS PHARMACEUTICALS INC. - Daily