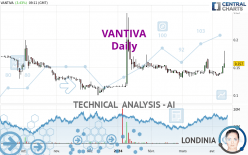
VANTIVA - Daily - Technical analysis published on 04/12/2024 (GMT)
- 108
- 0
Click here for a new analysis!
- Timeframe : Daily
- - Analysis generated on
- Status : INVALID

Summary of the analysis

Additional analysis
Quotes
The VANTIVA price is 0.1570 EUR. On the day, this instrument gained +3.43% and was traded between 0.1500 EUR and 0.1800 EUR over the period. The price is currently at +4.67% from its lowest and -12.78% from its highest.A bearish opening was detected by the Central Gaps scanner. Sellers are trying to impose a bearish trend in the very short term.
Bearish opening
Type : Bearish
Timeframe : Openning
A study of price movements over other periods shows the following variations:
New HIGH record (1 month)
Type : Bullish
Timeframe : Weekly
Technical
Technical analysis of this Daily chart of VANTIVA indicates that the overall trend is strongly bullish. 82.14% of the signals given by moving averages are bullish. The overall trend is supported by the strong bullish signals from short-term moving averages. An assessment of moving averages reveals several bullish signals that could impact this trend:
Bullish trend reversal : adaptative moving average 20
Type : Bullish
Timeframe : Daily
Bullish trend reversal : adaptative moving average 50
Type : Bullish
Timeframe : Daily
Bullish trend reversal : adaptative moving average 100
Type : Bullish
Timeframe : Daily
An assessment of technical indicators shows a strong bullish signal.
But beware of excesses. The Central Indicators scanner currently detects this:
CCI indicator is overbought : over 100
Type : Neutral
Timeframe : Daily
Pivot points : price is over resistance 1
Type : Neutral
Timeframe : Daily
Pivot points : price is over resistance 3
Type : Neutral
Timeframe : Weekly
Parabolic SAR indicator bullish reversal
Type : Bullish
Timeframe : Daily
Aroon indicator bullish trend
Type : Bullish
Timeframe : Daily
MACD indicator is back over 0
Type : Bullish
Timeframe : Daily
Ichimoku - Bullish crossover : Tenkan & Kijun
Type : Bullish
Timeframe : Daily
Momentum indicator is back over 0
Type : Bullish
Timeframe : Daily
An analysis of the price chart with the Central Patterns scanner (detector of chart patterns and resistances and supports) shows a result that can have an impact on the price change:
Resistance of triangle is broken
Type : Bullish
Timeframe : Daily
For a small rebound in the very short term, the Central Candlesticks scanner currently notes the presence of these bullish patterns in Japanese candlesticks:
White line without lower shadow
Type : Bullish
Timeframe : Daily
Long white line
Type : Bullish
Timeframe : Daily
| S2 | S1 | Price | R1 | R2 | R3 | |
|---|---|---|---|---|---|---|
| ProTrendLines | 0.1147 | 0.1356 | 0.1570 | 0.1596 | 0.1830 | 0.2000 |
| Change (%) | -26.94% | -13.63% | - | +1.66% | +16.56% | +27.39% |
| Change | -0.0423 | -0.0214 | - | +0.0026 | +0.0260 | +0.0430 |
| Level | Minor | Intermediate | - | Minor | Intermediate | Intermediate |
Pivot points can also be used to set your price objectives. Here is the price situation in relation to pivot points:
| Pivot points | S3 | S2 | S1 | PP | R1 | R2 | R3 |
|---|---|---|---|---|---|---|---|
| Standard | 0.1291 | 0.1341 | 0.1429 | 0.1479 | 0.1567 | 0.1617 | 0.1705 |
| Camarilla | 0.1480 | 0.1493 | 0.1505 | 0.1518 | 0.1531 | 0.1543 | 0.1556 |
| Woodie | 0.1311 | 0.1351 | 0.1449 | 0.1489 | 0.1587 | 0.1627 | 0.1725 |
| Fibonacci | 0.1341 | 0.1393 | 0.1426 | 0.1479 | 0.1531 | 0.1564 | 0.1617 |
| Pivot points | S3 | S2 | S1 | PP | R1 | R2 | R3 |
|---|---|---|---|---|---|---|---|
| Standard | 0.1231 | 0.1291 | 0.1321 | 0.1381 | 0.1411 | 0.1471 | 0.1501 |
| Camarilla | 0.1327 | 0.1336 | 0.1344 | 0.1352 | 0.1360 | 0.1369 | 0.1377 |
| Woodie | 0.1217 | 0.1284 | 0.1307 | 0.1374 | 0.1397 | 0.1464 | 0.1487 |
| Fibonacci | 0.1291 | 0.1325 | 0.1346 | 0.1381 | 0.1415 | 0.1436 | 0.1471 |
| Pivot points | S3 | S2 | S1 | PP | R1 | R2 | R3 |
|---|---|---|---|---|---|---|---|
| Standard | 0.0921 | 0.1121 | 0.1261 | 0.1461 | 0.1601 | 0.1801 | 0.1941 |
| Camarilla | 0.1309 | 0.1340 | 0.1371 | 0.1402 | 0.1433 | 0.1464 | 0.1496 |
| Woodie | 0.0892 | 0.1106 | 0.1232 | 0.1446 | 0.1572 | 0.1786 | 0.1912 |
| Fibonacci | 0.1121 | 0.1251 | 0.1331 | 0.1461 | 0.1591 | 0.1671 | 0.1801 |
Numerical data
The following are the details of the technical indicators and moving averages that were collected to generate this technical analysis:
| RSI (14): | 65.84 | |
| MACD (12,26,9): | 0.0013 | |
| Directional Movement: | 31.5760 | |
| AROON (14): | 35.7143 | |
| DEMA (21): | 0.1454 | |
| Parabolic SAR (0,02-0,02-0,2): | 0.1350 | |
| Elder Ray (13): | 0.0199 | |
| Super Trend (3,10): | 0.1368 | |
| Zig ZAG (10): | 0.1610 | |
| VORTEX (21): | 1.0881 | |
| Stochastique (14,3,5): | 42.70 | |
| TEMA (21): | 0.1468 | |
| Williams %R (14): | -42.22 | |
| Chande Momentum Oscillator (20): | 0.0014 | |
| Repulse (5,40,3): | 8.3052 | |
| ROCnROLL: | 1 | |
| TRIX (15,9): | -0.0258 | |
| Courbe Coppock: | 1.92 |
| MA7: | 0.1437 | |
| MA20: | 0.1438 | |
| MA50: | 0.1444 | |
| MA100: | 0.1370 | |
| MAexp7: | 0.1474 | |
| MAexp20: | 0.1443 | |
| MAexp50: | 0.1433 | |
| MAexp100: | 0.1445 | |
| Price / MA7: | +9.26% | |
| Price / MA20: | +9.18% | |
| Price / MA50: | +8.73% | |
| Price / MA100: | +14.60% | |
| Price / MAexp7: | +6.51% | |
| Price / MAexp20: | +8.80% | |
| Price / MAexp50: | +9.56% | |
| Price / MAexp100: | +8.65% |
News
The last news published on VANTIVA at the time of the generation of this analysis was as follows:
- Vantiva - March 2024 - Information concerning the total number of voting rights and shares
- RESULTS 2023 - VANTIVA ACHIEVES ITS OBJECTIVES
- Vantiva Demonstrates One of the First Carrier-Grade Wi-Fi 7 Extenders and Advanced 5G FWA CPE at Mobile World Congress 2024
- Vantiva - January 2024 - Information concerning the total number of voting rights and shares
- Tim O’Loughlin is joining Vantiva Connected Home as Senior Vice President of the Americas Customer Unit
About author
Online


Add a comment
Comments
0 comments on the analysis VANTIVA - Daily