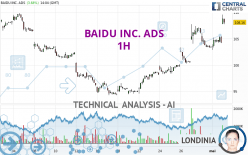
BAIDU INC. ADS - 1H - Technical analysis published on 05/02/2024 (GMT)
- 76
- 0
Click here for a new analysis!
- Timeframe : 1H
- - Analysis generated on
- Status : TARGET REACHED

Summary of the analysis

Additional analysis
Quotes
The BAIDU INC. ADS price is 108.46 USD. The price registered an increase of +3.97% on the session and was between 107.81 USD and 109.59 USD. This implies that the price is at +0.60% from its lowest and at -1.03% from its highest.A bullish gap was detected at the opening by the Central Gaps scanner. There are a lot of buyers and they have the upper hand in the very short term.
Opening Gap UP
Type : Bullish
Timeframe : Openning
A study of price movements over other periods shows the following variations:
Near a new HIGH record (1 month)
Type : Bullish
Timeframe : Weekly
Technical
Technical analysis of this 1H chart of BAIDU INC. ADS indicates that the overall trend is strongly bullish. 92.86% of the signals given by moving averages are bullish. This strongly bullish trend is supported by the strong bullish signals given by short-term moving averages. The Central Indicators scanner detects bullish signals on moving averages that could impact this trend:
Bullish price crossover with Moving Average 20
Type : Bullish
Timeframe : 1 hour
Bullish price crossover with adaptative moving average 20
Type : Bullish
Timeframe : 1 hour
In fact, according to the parameters integrated into the Central Analyzer system, 14 technical indicators out of 18 analysed are currently bullish. Caution: the Central Indicators scanner currently detects an excess:
RSI indicator is overbought : over 70
Type : Neutral
Timeframe : 1 hour
CCI indicator is overbought : over 100
Type : Neutral
Timeframe : 1 hour
Williams %R indicator is overbought : over -20
Type : Neutral
Timeframe : 1 hour
Pivot points : price is over resistance 2
Type : Neutral
Timeframe : Weekly
Pivot points : price is over resistance 3
Type : Neutral
Timeframe : 1 hour
MACD crosses UP its Moving Average
Type : Bullish
Timeframe : 1 hour
Aroon indicator bullish trend
Type : Bullish
Timeframe : 1 hour
Momentum indicator is back over 0
Type : Bullish
Timeframe : 1 hour
An analysis of the price chart with the Central Patterns scanner (detector of chart patterns and resistances and supports) shows several results that can have an impact on the price change:
Near horizontal resistance
Type : Bearish
Timeframe : 1 hour
Resistance of channel is broken
Type : Bullish
Timeframe : 1 hour
For a small setback in the very short term, the Central Candlesticks scanner currently notes the presence of this bearish pattern in Japanese candlesticks:
Bearish harami
Type : Bearish
Timeframe : 1 hour
Bearish harami cross
Type : Bearish
Timeframe : 1 hour
| S3 | S2 | S1 | Price | R1 | R2 | R3 | |
|---|---|---|---|---|---|---|---|
| ProTrendLines | 105.34 | 106.56 | 107.80 | 108.46 | 109.91 | 124.92 | 134.68 |
| Change (%) | -2.88% | -1.75% | -0.61% | - | +1.34% | +15.18% | +24.17% |
| Change | -3.12 | -1.90 | -0.66 | - | +1.45 | +16.46 | +26.22 |
| Level | Major | Intermediate | Intermediate | - | Intermediate | Intermediate | Minor |
To determine price objectives, it is also possible to use the pivot points. Here is the price position in relation to pivot points:
| Pivot points | S3 | S2 | S1 | PP | R1 | R2 | R3 |
|---|---|---|---|---|---|---|---|
| Standard | 100.32 | 101.60 | 102.96 | 104.24 | 105.60 | 106.88 | 108.24 |
| Camarilla | 103.59 | 103.84 | 104.08 | 104.32 | 104.56 | 104.80 | 105.05 |
| Woodie | 100.36 | 101.62 | 103.00 | 104.26 | 105.64 | 106.90 | 108.28 |
| Fibonacci | 101.60 | 102.61 | 103.23 | 104.24 | 105.25 | 105.87 | 106.88 |
| Pivot points | S3 | S2 | S1 | PP | R1 | R2 | R3 |
|---|---|---|---|---|---|---|---|
| Standard | 86.77 | 90.66 | 95.59 | 99.48 | 104.41 | 108.30 | 113.23 |
| Camarilla | 98.10 | 98.90 | 99.71 | 100.52 | 101.33 | 102.14 | 102.95 |
| Woodie | 87.29 | 90.92 | 96.11 | 99.74 | 104.93 | 108.56 | 113.75 |
| Fibonacci | 90.66 | 94.03 | 96.11 | 99.48 | 102.85 | 104.93 | 108.30 |
| Pivot points | S3 | S2 | S1 | PP | R1 | R2 | R3 |
|---|---|---|---|---|---|---|---|
| Standard | 79.47 | 86.86 | 95.13 | 102.52 | 110.79 | 118.18 | 126.45 |
| Camarilla | 99.09 | 100.53 | 101.97 | 103.40 | 104.84 | 106.27 | 107.71 |
| Woodie | 79.91 | 87.08 | 95.57 | 102.74 | 111.23 | 118.40 | 126.89 |
| Fibonacci | 86.86 | 92.84 | 96.54 | 102.52 | 108.50 | 112.20 | 118.18 |
Numerical data
The following are the details of the technical indicators and moving averages that were collected to generate this technical analysis:
| RSI (14): | 71.83 | |
| MACD (12,26,9): | 1.0800 | |
| Directional Movement: | 30.89 | |
| AROON (14): | 50.00 | |
| DEMA (21): | 105.95 | |
| Parabolic SAR (0,02-0,02-0,2): | 102.88 | |
| Elder Ray (13): | 3.69 | |
| Super Trend (3,10): | 104.44 | |
| Zig ZAG (10): | 108.70 | |
| VORTEX (21): | 0.9800 | |
| Stochastique (14,3,5): | 64.38 | |
| TEMA (21): | 105.89 | |
| Williams %R (14): | -10.13 | |
| Chande Momentum Oscillator (20): | 5.16 | |
| Repulse (5,40,3): | 0.7600 | |
| ROCnROLL: | 1 | |
| TRIX (15,9): | 0.1400 | |
| Courbe Coppock: | 0.00 |
| MA7: | 103.10 | |
| MA20: | 100.47 | |
| MA50: | 103.01 | |
| MA100: | 106.54 | |
| MAexp7: | 106.23 | |
| MAexp20: | 104.47 | |
| MAexp50: | 102.48 | |
| MAexp100: | 101.41 | |
| Price / MA7: | +5.20% | |
| Price / MA20: | +7.95% | |
| Price / MA50: | +5.29% | |
| Price / MA100: | +1.80% | |
| Price / MAexp7: | +2.10% | |
| Price / MAexp20: | +3.82% | |
| Price / MAexp50: | +5.84% | |
| Price / MAexp100: | +6.95% |
News
Don't forget to follow the news on BAIDU INC. ADS. At the time of publication of this analysis, the latest news was as follows:
- Baidu Launches Second ERNIE Cup, A Global Innovation Challenge to Discover the Next Big AI-Native Applications
- Baidu Presents a Suite of Toolkits and Models to Supercharge AI Creativity at Create 2024
- Baidu to Report First Quarter 2024 Financial Results on May 16, 2024
- /C O R R E C T I O N -- Baidu, Inc./
- Baidu Create 2024: Empowering Everyone as Creators of the AI Future
About author
Online


Add a comment
Comments
0 comments on the analysis BAIDU INC. ADS - 1H