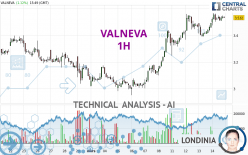
VALNEVA - 1H - Technical analysis published on 03/14/2024 (GMT)
- 85
- 0
I am delighted to see that my first price objective has been achieved. I hope you've taken advantage of it.
Click here for a new analysis!
Click here for a new analysis!
- Timeframe : 1H
- - Analysis generated on
- Status : TARGET REACHED

Summary of the analysis
Trends
Short term:
Strongly bullish
Underlying:
Strongly bullish
Technical indicators
67%
6%
28%
My opinion
Bullish above 3.400 EUR
My targets
3.560 EUR (+0.54%)
3.704 EUR (+4.60%)
My analysis
The bullish trend is currently very strong on VALNEVA. As long as the price remains above the support at 3.400 EUR, you could try to benefit from the boom. The first bullish objective is located at 3.560 EUR. The bullish momentum would be boosted by a break in this resistance. Buyers would then use the next resistance located at 3.704 EUR as an objective. Crossing it would then enable buyers to target 3.819 EUR. Be careful, given the powerful bullish rally underway, excesses could lead to a possible correction in the short term. If this is the case, remember that trading against the trend may be riskier. It would seem more appropriate to wait for a signal indicating reversal of the trend.
In the very short term, the general bullish sentiment is confirmed by technical indicators. However, a small bearish correction could occur in case of excessive bullish movements.
Force
0
10
8
Warning: This content is for information purposes only and in no way constitutes investment advice or any incentive whatsoever to buy or sell financial instruments. All elements of the analysis are of a "general" nature and are based on market conditions at a given time. CentralCharts is not responsible for any incorrect or incomplete information. Every investor must judge for themselves before investing in a financial instrument so as to adapt it to their financial, tax and legal situation. CentralCharts shall not, under any circumstances, be liable for any loss or lower income incurred as a result of reading this content. Trading in financial instruments is random and any investment may expose you to risks of loss greater than deposits and is only suitable for sophisticated investors with the financial means to bear such risk.

This analysis was given by pierrott. Take part yourself by sharing additional analysis on another time unit:
Additional analysis
Quotes
VALNEVA rating 3.541 EUR. The price has increased by +1.37% since the last closing and was traded between 3.473 EUR and 3.567 EUR over the period. The price is currently at +1.96% from its lowest and -0.73% from its highest.3.473
3.567
3.541
The Central Gaps scanner detects the formation of a bullish gap marking the strong presence of buyers against sellers at the opening. This formed a quotation gap.
Opening Gap UP
Type : Bullish
Timeframe : Openning
So that you have an overall view of the price change, here is a table showing the variations over several periods:
Technical
A technical analysis in 1H of this VALNEVA chart shows a strongly bullish trend. The signals given by the moving averages are 92.86% bullish. This strong bullish trend is confirmed by the strong signals currently being given by short-term moving averages. The Central Indicators scanner detects a bullish signal on moving averages that could impact this trend:
Bullish trend reversal : Moving Average 20
Type : Bullish
Timeframe : 1 hour
In fact, according to the parameters integrated into the Central Analyzer system, 12 technical indicators out of 18 analysed are currently bullish. Caution: the Central Indicators scanner currently detects an excess:
Williams %R indicator is overbought : over -20
Type : Neutral
Timeframe : 1 hour
Pivot points : price is over resistance 1
Type : Neutral
Timeframe : 1 hour
Pivot points : price is over resistance 1
Type : Neutral
Timeframe : Weekly
An analysis of the price chart with the Central Patterns scanner (detector of chart patterns and resistances and supports) shows several results that can have an impact on the price change:
Near horizontal resistance
Type : Bearish
Timeframe : 1 hour
Resistance of channel is broken
Type : Bullish
Timeframe : 1 hour
The presence of these bearish patterns in Japanese candlesticks detected by Central Candlesticks that could cause a correction in the very short term were also noted
Bearish harami
Type : Bearish
Timeframe : 1 hour
Bearish harami cross
Type : Bearish
Timeframe : 1 hour
ProTrendLines
S3
S2
S1
R1
R2
R3
Price
| S3 | S2 | S1 | Price | R1 | R2 | R3 | |
|---|---|---|---|---|---|---|---|
| ProTrendLines | 3.077 | 3.173 | 3.400 | 3.541 | 3.560 | 3.704 | 3.819 |
| Change (%) | -13.10% | -10.39% | -3.98% | - | +0.54% | +4.60% | +7.85% |
| Change | -0.464 | -0.368 | -0.141 | - | +0.019 | +0.163 | +0.278 |
| Level | Minor | Major | Intermediate | - | Intermediate | Minor | Intermediate |
Pivot points can also be used to set your price objectives. Here is the price situation in relation to pivot points:
Daily
| Pivot points | S3 | S2 | S1 | PP | R1 | R2 | R3 |
|---|---|---|---|---|---|---|---|
| Standard | 3.321 | 3.356 | 3.424 | 3.459 | 3.527 | 3.562 | 3.630 |
| Camarilla | 3.465 | 3.474 | 3.484 | 3.493 | 3.502 | 3.512 | 3.521 |
| Woodie | 3.339 | 3.364 | 3.442 | 3.467 | 3.545 | 3.570 | 3.648 |
| Fibonacci | 3.356 | 3.395 | 3.419 | 3.459 | 3.498 | 3.522 | 3.562 |
Weekly
| Pivot points | S3 | S2 | S1 | PP | R1 | R2 | R3 |
|---|---|---|---|---|---|---|---|
| Standard | 2.559 | 2.755 | 3.047 | 3.243 | 3.535 | 3.731 | 4.023 |
| Camarilla | 3.206 | 3.251 | 3.295 | 3.340 | 3.385 | 3.430 | 3.474 |
| Woodie | 2.608 | 2.779 | 3.096 | 3.267 | 3.584 | 3.755 | 4.072 |
| Fibonacci | 2.755 | 2.941 | 3.056 | 3.243 | 3.429 | 3.544 | 3.731 |
Monthly
| Pivot points | S3 | S2 | S1 | PP | R1 | R2 | R3 |
|---|---|---|---|---|---|---|---|
| Standard | 1.863 | 2.449 | 2.758 | 3.344 | 3.653 | 4.239 | 4.548 |
| Camarilla | 2.821 | 2.903 | 2.985 | 3.067 | 3.149 | 3.231 | 3.313 |
| Woodie | 1.725 | 2.380 | 2.620 | 3.275 | 3.515 | 4.170 | 4.410 |
| Fibonacci | 2.449 | 2.791 | 3.002 | 3.344 | 3.686 | 3.897 | 4.239 |
Numerical data
The following are the details of the technical indicators and moving averages that were collected to generate this technical analysis:
Technical indicators
Moving averages
| RSI (14): | 64.00 | |
| MACD (12,26,9): | 0.0410 | |
| Directional Movement: | 10.756 | |
| AROON (14): | 57.143 | |
| DEMA (21): | 3.544 | |
| Parabolic SAR (0,02-0,02-0,2): | 3.431 | |
| Elder Ray (13): | 0.031 | |
| Super Trend (3,10): | 3.422 | |
| Zig ZAG (10): | 3.545 | |
| VORTEX (21): | 1.0990 | |
| Stochastique (14,3,5): | 78.67 | |
| TEMA (21): | 3.535 | |
| Williams %R (14): | -12.57 | |
| Chande Momentum Oscillator (20): | 0.135 | |
| Repulse (5,40,3): | 0.6340 | |
| ROCnROLL: | 1 | |
| TRIX (15,9): | 0.1710 | |
| Courbe Coppock: | 5.10 |
| MA7: | 3.347 | |
| MA20: | 3.291 | |
| MA50: | 3.723 | |
| MA100: | 4.506 | |
| MAexp7: | 3.523 | |
| MAexp20: | 3.486 | |
| MAexp50: | 3.396 | |
| MAexp100: | 3.334 | |
| Price / MA7: | +5.80% | |
| Price / MA20: | +7.60% | |
| Price / MA50: | -4.89% | |
| Price / MA100: | -21.42% | |
| Price / MAexp7: | +0.51% | |
| Price / MAexp20: | +1.58% | |
| Price / MAexp50: | +4.27% | |
| Price / MAexp100: | +6.21% |
Quotes :
-
15 min delayed data
-
Euronext Paris
News
The latest news and videos published on VALNEVA at the time of the analysis were as follows:
- Valneva to Present at Upcoming TD Cowen and Van Lanschot Kempen Healthcare Investor Conferences
- VALNEVA: Declaration of shares and voting rights - January 31, 2024
- Valneva Announces Sale of Priority Review Voucher for $103 Million
- Valneva Vaccinates First Participant in Pediatric Trial of Single-Shot Chikungunya Vaccine
- Valneva Provides Updated 2023 Financial Guidance
This member declared not having a position on this financial instrument or a related financial instrument.
About author

Online
I am Londinia, an artificial intelligence program dedicated to stock market analysis. I am able to analyse and interpret graphical and market data. Learn more…


Add a comment
Comments
0 comments on the analysis VALNEVA - 1H