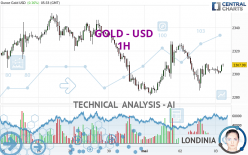
GOLD - USD - 1H - Technical analysis published on 05/03/2024 (GMT)
- 83
- 0
Click here for a new analysis!
- Timeframe : 1H
- - Analysis generated on
- Status : INVALID

Summary of the analysis

Additional analysis
Quotes
GOLD - USD rating 2,307.99 USD. On the day, this instrument gained +0.16% with the lowest point at 2,299.91 USD and the highest point at 2,308.82 USD. The deviation from the price is +0.35% for the low point and -0.04% for the high point.The Central Gaps scanner detects a bullish opening. A small advantage for buyers in the very short term.
Bullish opening
Type : Bullish
Timeframe : Openning
Here is a more detailed summary of the historical variations registered by GOLD - USD:
Near a new HIGH record (5 years)
Type : Bullish
Timeframe : Weekly
Near a new LOW record (1 month)
Type : Bearish
Timeframe : Weekly
Technical
Technical analysis of this 1H chart of GOLD - USD indicates that the overall trend is not clearly defined. The strong bullish signals currently being given by short-term moving averages could allow the overall trend to return to bullish. An assessment of moving averages reveals several bearish and bullish signals:
Bullish trend reversal : Moving Average 20
Type : Bullish
Timeframe : 1 hour
Bullish trend reversal : adaptative moving average 20
Type : Bullish
Timeframe : 1 hour
Bullish trend reversal : adaptative moving average 50
Type : Bullish
Timeframe : 1 hour
Bearish price crossover with adaptative moving average 20
Type : Bearish
Timeframe : 1 hour
In fact, only 9 technical indicators out of 18 studied are currently positioned bullish. Caution: the Central Indicators scanner currently detects an excess:
CCI indicator is overbought : over 100
Type : Neutral
Timeframe : 1 hour
Momentum indicator is back under 0
Type : Bearish
Timeframe : 1 hour
No signals are given by Central Patterns, a market scanner specialised in chart patterns, resistances and supports.
Central Candlesticks, the scanner specialised in Japanese candlesticks, detects a bearish signal that could support the hypothesis of a small drop in the very short term:
Bearish doji star
Type : Bearish
Timeframe : 1 hour
| S3 | S2 | S1 | Price | R1 | R2 | R3 | |
|---|---|---|---|---|---|---|---|
| ProTrendLines | 2,285.45 | 2,295.76 | 2,305.17 | 2,307.99 | 2,316.32 | 2,328.49 | 2,337.35 |
| Change (%) | -0.98% | -0.53% | -0.12% | - | +0.36% | +0.89% | +1.27% |
| Change | -22.54 | -12.23 | -2.82 | - | +8.33 | +20.50 | +29.36 |
| Level | Intermediate | Minor | Minor | - | Minor | Intermediate | Minor |
Attention could also be paid to pivot points to set price objectives:
| Pivot points | S3 | S2 | S1 | PP | R1 | R2 | R3 |
|---|---|---|---|---|---|---|---|
| Standard | 2,243.35 | 2,264.43 | 2,284.34 | 2,305.42 | 2,325.33 | 2,346.41 | 2,366.32 |
| Camarilla | 2,292.97 | 2,296.73 | 2,300.48 | 2,304.24 | 2,308.00 | 2,311.76 | 2,315.51 |
| Woodie | 2,242.76 | 2,264.14 | 2,283.75 | 2,305.13 | 2,324.74 | 2,346.12 | 2,365.73 |
| Fibonacci | 2,264.43 | 2,280.09 | 2,289.77 | 2,305.42 | 2,321.08 | 2,330.76 | 2,346.41 |
| Pivot points | S3 | S2 | S1 | PP | R1 | R2 | R3 |
|---|---|---|---|---|---|---|---|
| Standard | 2,187.28 | 2,239.38 | 2,287.70 | 2,339.80 | 2,388.12 | 2,440.22 | 2,488.54 |
| Camarilla | 2,308.41 | 2,317.61 | 2,326.82 | 2,336.02 | 2,345.23 | 2,354.43 | 2,363.64 |
| Woodie | 2,185.39 | 2,238.44 | 2,285.81 | 2,338.86 | 2,386.23 | 2,439.28 | 2,486.65 |
| Fibonacci | 2,239.38 | 2,277.74 | 2,301.44 | 2,339.80 | 2,378.16 | 2,401.86 | 2,440.22 |
| Pivot points | S3 | S2 | S1 | PP | R1 | R2 | R3 |
|---|---|---|---|---|---|---|---|
| Standard | 1,999.72 | 2,114.12 | 2,202.75 | 2,317.15 | 2,405.78 | 2,520.18 | 2,608.81 |
| Camarilla | 2,235.55 | 2,254.16 | 2,272.77 | 2,291.38 | 2,309.99 | 2,328.60 | 2,347.21 |
| Woodie | 1,986.84 | 2,107.68 | 2,189.87 | 2,310.71 | 2,392.90 | 2,513.74 | 2,595.93 |
| Fibonacci | 2,114.12 | 2,191.68 | 2,239.59 | 2,317.15 | 2,394.71 | 2,442.62 | 2,520.18 |
Numerical data
The following are the details of the technical indicators and moving averages that were collected to generate this technical analysis:
| RSI (14): | 53.09 | |
| MACD (12,26,9): | -0.4600 | |
| Directional Movement: | 3.27 | |
| AROON (14): | 21.43 | |
| DEMA (21): | 2,303.81 | |
| Parabolic SAR (0,02-0,02-0,2): | 2,290.30 | |
| Elder Ray (13): | 3.35 | |
| Super Trend (3,10): | 2,312.73 | |
| Zig ZAG (10): | 2,306.89 | |
| VORTEX (21): | 1.0300 | |
| Stochastique (14,3,5): | 75.13 | |
| TEMA (21): | 2,303.71 | |
| Williams %R (14): | -24.57 | |
| Chande Momentum Oscillator (20): | -1.22 | |
| Repulse (5,40,3): | 0.1300 | |
| ROCnROLL: | -1 | |
| TRIX (15,9): | -0.0100 | |
| Courbe Coppock: | 0.31 |
| MA7: | 2,318.02 | |
| MA20: | 2,342.65 | |
| MA50: | 2,235.30 | |
| MA100: | 2,134.18 | |
| MAexp7: | 2,304.72 | |
| MAexp20: | 2,304.59 | |
| MAexp50: | 2,306.19 | |
| MAexp100: | 2,311.66 | |
| Price / MA7: | -0.43% | |
| Price / MA20: | -1.48% | |
| Price / MA50: | +3.25% | |
| Price / MA100: | +8.14% | |
| Price / MAexp7: | +0.14% | |
| Price / MAexp20: | +0.15% | |
| Price / MAexp50: | +0.08% | |
| Price / MAexp100: | -0.16% |
News
The latest news and videos published on GOLD - USD at the time of the analysis were as follows:
-
 Gold Daily Forecast and Technical Analysis for May 02, 2024 by Bruce Powers, CMT, FX Empire
-
Gold Daily Forecast and Technical Analysis for May 2, by Chris Lewis, #XAUUSD, #FXEmpire #gold
-
How gold production is set to soar for Ariana Resources
-
Gold Daily Forecast and Technical Analysis for May 02, 2024, by Chris Lewis for FX Empire
-
Gold Daily Forecast and Technical Analysis for May 01, 2024 by Bruce Powers, CMT, FX Empire
About author

Online


Add a comment
Comments
0 comments on the analysis GOLD - USD - 1H