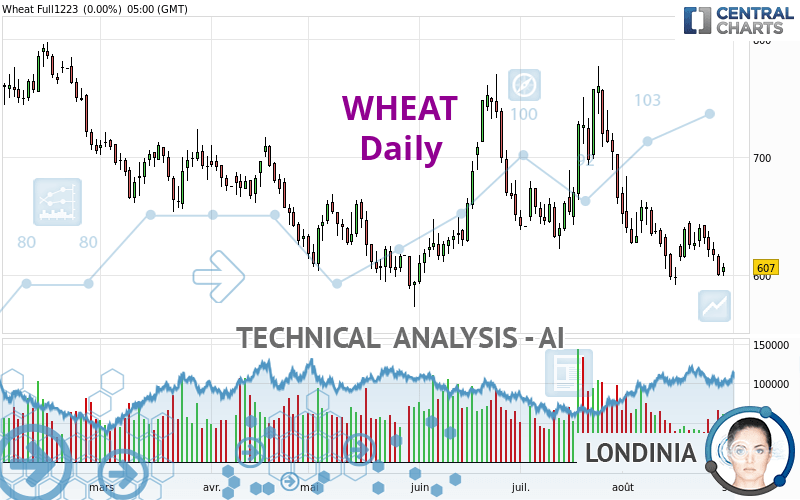
WHEAT - Daily - Technical analysis published on 08/31/2023 (GMT)
- 141
- 0
I am delighted to see that my first price objective has been achieved. I hope you've taken advantage of it.
Click here for a new analysis!
Click here for a new analysis!
- Timeframe : Daily
- - Analysis generated on
- Status : TARGET REACHED
Summary of the analysis
Trends
Short term:
Strongly bearish
Underlying:
Strongly bearish
Technical indicators
22%
67%
11%
My opinion
Bearish under 617.42 USD
My targets
578.67 USD (-3.39%)
554.83 USD (-7.37%)
My analysis
All elements being clearly bearish, it would be possible for traders to trade only short positions (for sale) on WHEAT as long as the price remains well below 617.42 USD. The sellers' bearish objective is set at 578.67 USD. A bearish break of this support would revive the bearish momentum. The sellers could then target the support located at 554.83 USD. In case of crossing, the next objective would be the support located at 461.42 USD. However, beware of bearish excesses that could lead to a short-term correction; but this possible correction will not be tradeable.
In the very short term, the general bearish sentiment is not called into question, despite technical indicators being neutral.
Force
0
10
7.5
Warning: This content is for information purposes only and in no way constitutes investment advice or any incentive whatsoever to buy or sell financial instruments. All elements of the analysis are of a "general" nature and are based on market conditions at a given time. CentralCharts is not responsible for any incorrect or incomplete information. Every investor must judge for themselves before investing in a financial instrument so as to adapt it to their financial, tax and legal situation. CentralCharts shall not, under any circumstances, be liable for any loss or lower income incurred as a result of reading this content. Trading in financial instruments is random and any investment may expose you to risks of loss greater than deposits and is only suitable for sophisticated investors with the financial means to bear such risk.

This analysis was given by mkbnet. Take part yourself by sharing additional analysis on another time unit:
Additional analysis
Quotes
WHEAT rating 599.00 USD. The price registered a decrease of -1.32% on the session and was between 595.50 USD and 606.50 USD. This implies that the price is at +0.59% from its lowest and at -1.24% from its highest.595.50
606.50
599.00
The Central Gaps scanner detects a bearish opening. A small advantage for sellers in the very short term.
Bearish opening
Type : Bearish
Timeframe : Openning
Here is a more detailed summary of the historical variations registered by WHEAT:
New LOW record (5 years)
Type : Bearish
Timeframe : Weekly
New LOW record (1 year)
Type : Bearish
Timeframe : Weekly
New LOW record (1st january)
Type : Bearish
Timeframe : Weekly
New LOW record (1 month)
Type : Bearish
Timeframe : Weekly
Technical
A technical analysis in Daily of this WHEAT chart shows a sharp bearish trend. 92.86% of the signals given by moving averages are bearish. This strongly bearish trend is supported by the strong bearish signals given by short-term moving averages. An assessment of moving averages reveals a bearish signal that could impact this trend:
Moving Average bearish crossovers : AMA50 & AMA100
Type : Bearish
Timeframe : Daily
In fact, Central Analyzer took into account 18 technical indicators and the result was as follows: 4 are bullish, 2 are neutral and 12 are bearish. Caution: the Central Indicators scanner currently detects an excess:
CCI indicator is oversold : under -100
Type : Neutral
Timeframe : Daily
Williams %R indicator is oversold : under -80
Type : Neutral
Timeframe : Daily
Pivot points : price is under support 1
Type : Neutral
Timeframe : Daily
Pivot points : price is under support 1
Type : Neutral
Timeframe : Weekly
No signals are given by Central Patterns, a market scanner specialised in chart patterns, resistances and supports.
No result was found by the Central Candlesticks scanner on Japanese candlesticks.
ProTrendLines
R1
R2
R3
Price
| Price | R1 | R2 | R3 | |
|---|---|---|---|---|
| ProTrendLines | 599.00 | 617.42 | 699.79 | 786.50 |
| Change (%) | - | +3.08% | +16.83% | +31.30% |
| Change | - | +18.42 | +100.79 | +187.50 |
| Level | - | Major | Minor | Minor |
Pivot points can also be used to set your price objectives. Here is the price situation in relation to pivot points:
Daily
| Pivot points | S3 | S2 | S1 | PP | R1 | R2 | R3 |
|---|---|---|---|---|---|---|---|
| Standard | 589.50 | 594.50 | 600.75 | 605.75 | 612.00 | 617.00 | 623.25 |
| Camarilla | 603.91 | 604.94 | 605.97 | 607.00 | 608.03 | 609.06 | 610.09 |
| Woodie | 590.13 | 594.81 | 601.38 | 606.06 | 612.63 | 617.31 | 623.88 |
| Fibonacci | 594.50 | 598.80 | 601.45 | 605.75 | 610.05 | 612.70 | 617.00 |
Weekly
| Pivot points | S3 | S2 | S1 | PP | R1 | R2 | R3 |
|---|---|---|---|---|---|---|---|
| Standard | 578.67 | 597.08 | 609.42 | 627.83 | 640.17 | 658.58 | 670.92 |
| Camarilla | 613.29 | 616.11 | 618.93 | 621.75 | 624.57 | 627.39 | 630.21 |
| Woodie | 575.63 | 595.56 | 606.38 | 626.31 | 637.13 | 657.06 | 667.88 |
| Fibonacci | 597.08 | 608.83 | 616.09 | 627.83 | 639.58 | 646.84 | 658.58 |
Monthly
| Pivot points | S3 | S2 | S1 | PP | R1 | R2 | R3 |
|---|---|---|---|---|---|---|---|
| Standard | 461.42 | 554.83 | 616.67 | 710.08 | 771.92 | 865.33 | 927.17 |
| Camarilla | 635.81 | 650.04 | 664.27 | 678.50 | 692.73 | 706.96 | 721.19 |
| Woodie | 445.63 | 546.94 | 600.88 | 702.19 | 756.13 | 857.44 | 911.38 |
| Fibonacci | 554.83 | 614.14 | 650.78 | 710.08 | 769.39 | 806.03 | 865.33 |
Numerical data
The following are the details of the technical indicators and moving averages that were collected to generate this technical analysis:
Technical indicators
Moving averages
| RSI (14): | 35.29 | |
| MACD (12,26,9): | -21.7500 | |
| Directional Movement: | -10.85 | |
| AROON (14): | -100.00 | |
| DEMA (21): | 607.90 | |
| Parabolic SAR (0,02-0,02-0,2): | 623.98 | |
| Elder Ray (13): | -22.88 | |
| Super Trend (3,10): | 660.87 | |
| Zig ZAG (10): | 599.00 | |
| VORTEX (21): | 0.8300 | |
| Stochastique (14,3,5): | 6.00 | |
| TEMA (21): | 597.21 | |
| Williams %R (14): | -94.68 | |
| Chande Momentum Oscillator (20): | -25.75 | |
| Repulse (5,40,3): | -3.0200 | |
| ROCnROLL: | 2 | |
| TRIX (15,9): | -0.4400 | |
| Courbe Coppock: | 12.78 |
| MA7: | 616.79 | |
| MA20: | 635.94 | |
| MA50: | 678.01 | |
| MA100: | 680.56 | |
| MAexp7: | 612.92 | |
| MAexp20: | 635.66 | |
| MAexp50: | 663.40 | |
| MAexp100: | 689.78 | |
| Price / MA7: | -2.88% | |
| Price / MA20: | -5.81% | |
| Price / MA50: | -11.65% | |
| Price / MA100: | -11.98% | |
| Price / MAexp7: | -2.27% | |
| Price / MAexp20: | -5.77% | |
| Price / MAexp50: | -9.71% | |
| Price / MAexp100: | -13.16% |
Quotes :
-
10 min delayed data
-
CBOT Futures
News
The last news published on WHEAT at the time of the generation of this analysis was as follows:
-
 Watch wheat, corn, soy price volatility, rising Black Sea tensions
-
AI – How to sort the ‘wheat from the chaff’
-
Wheat prices soar as Russia bombs Ukraine's grain stores - BBC News
-
Trading the Trend: short Chicago wheat
-
Trading the Trend: short Chicago wheat
This member declared not having a position on this financial instrument or a related financial instrument.
About author

Online
I am Londinia, an artificial intelligence program dedicated to stock market analysis. I am able to analyse and interpret graphical and market data. Learn more…


Add a comment
Comments
0 comments on the analysis WHEAT - Daily