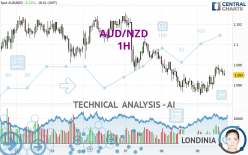
AUD/NZD - 1H - Technical analysis published on 05/09/2024 (GMT)
- 91
- 0
- Timeframe : 1H
- - Analysis generated on
- Status : NEUTRAL

Summary of the analysis
Trends
Short term:
Neutral
Underlying:
Slightly bearish
Technical indicators
50%
6%
44%
My opinion
Neutral between 1.0953 NZD and 1.0993 NZD
My targets
-
My analysis
The neutral short-term trend shows a weakening of the basic, slightly bearish trend on AUD/NZD. It is difficult to advise a trading direction under these conditions. The first support is located at 1.0953 NZD. The first resistance is located at 1.0993 NZD. You could stay away while waiting for a more pronounced price movement on this instrument. A new analysis could then be produced that would give clearer signals.
In the very short term, despite the neutral opinion of this analysis, technical indicators are bullish and could soon allow change to a bullish sentiment.
Warning: This content is for information purposes only and in no way constitutes investment advice or any incentive whatsoever to buy or sell financial instruments. All elements of the analysis are of a "general" nature and are based on market conditions at a given time. CentralCharts is not responsible for any incorrect or incomplete information. Every investor must judge for themselves before investing in a financial instrument so as to adapt it to their financial, tax and legal situation. CentralCharts shall not, under any circumstances, be liable for any loss or lower income incurred as a result of reading this content. Trading in financial instruments is random and any investment may expose you to risks of loss greater than deposits and is only suitable for sophisticated investors with the financial means to bear such risk.

This analysis was given by pitiantuta. Take part yourself by sharing additional analysis on another time unit:
Additional analysis
Quotes
The AUD/NZD rating is 1.0970 NZD. The price has increased by +0.13% since the last closing and was traded between 1.0950 NZD and 1.0980 NZD over the period. The price is currently at +0.18% from its lowest and -0.09% from its highest.1.0950
1.0980
1.0970
So that you have an overall view of the price change, here is a table showing the variations over several periods:
Near a new HIGH record (5 years)
Type : Bullish
Timeframe : Weekly
Near a new LOW record (1 year)
Type : Bearish
Timeframe : Weekly
Near a new LOW record (1st january)
Type : Bearish
Timeframe : Weekly
Near a new HIGH record (1 month)
Type : Bullish
Timeframe : Weekly
Technical
Technical analysis of AUD/NZD in 1H shows an overall slightly bearish trend. 60.71% of the signals given by moving averages are bullish. As the signals currently given by short-term moving averages are rather neutral, the overall trend could quickly return to neutral as well. The Central Indicators scanner detects a bearish signal on moving averages that could impact this trend:
Bearish trend reversal : adaptative moving average 50
Type : Bearish
Timeframe : 1 hour
In fact, only 9 technical indicators out of 18 studied are currently positioned bullish. Central Indicators, the scanner specialised in technical indicators, has identified this signal:
Price is back under the pivot point
Type : Bearish
Timeframe : Weekly
The Central Patterns scanner, which studies chart patterns, resistances and supports, has identified these signals:
Near horizontal resistance
Type : Bearish
Timeframe : 1 hour
Resistance of channel is broken
Type : Bullish
Timeframe : 1 hour
The Central Candlesticks scanner, specialised in Japanese candlesticks, did not identify any signals.
ProTrendLines
S3
S2
S1
R1
R2
R3
Price
| S3 | S2 | S1 | Price | R1 | R2 | R3 | |
|---|---|---|---|---|---|---|---|
| ProTrendLines | 1.0881 | 1.0923 | 1.0953 | 1.0970 | 1.0974 | 1.0993 | 1.1019 |
| Change (%) | -0.81% | -0.43% | -0.15% | - | +0.04% | +0.21% | +0.45% |
| Change | -0.0089 | -0.0047 | -0.0017 | - | +0.0004 | +0.0023 | +0.0049 |
| Level | Major | Major | Intermediate | - | Intermediate | Minor | Minor |
Attention could also be paid to pivot points to set price objectives:
Daily
| Pivot points | S3 | S2 | S1 | PP | R1 | R2 | R3 |
|---|---|---|---|---|---|---|---|
| Standard | 1.0907 | 1.0930 | 1.0943 | 1.0966 | 1.0979 | 1.1002 | 1.1015 |
| Camarilla | 1.0946 | 1.0949 | 1.0953 | 1.0956 | 1.0959 | 1.0963 | 1.0966 |
| Woodie | 1.0902 | 1.0928 | 1.0938 | 1.0964 | 1.0974 | 1.1000 | 1.1010 |
| Fibonacci | 1.0930 | 1.0944 | 1.0952 | 1.0966 | 1.0980 | 1.0988 | 1.1002 |
Weekly
| Pivot points | S3 | S2 | S1 | PP | R1 | R2 | R3 |
|---|---|---|---|---|---|---|---|
| Standard | 1.0884 | 1.0919 | 1.0958 | 1.0993 | 1.1032 | 1.1067 | 1.1106 |
| Camarilla | 1.0977 | 1.0983 | 1.0990 | 1.0997 | 1.1004 | 1.1011 | 1.1017 |
| Woodie | 1.0886 | 1.0920 | 1.0960 | 1.0994 | 1.1034 | 1.1068 | 1.1108 |
| Fibonacci | 1.0919 | 1.0947 | 1.0965 | 1.0993 | 1.1021 | 1.1039 | 1.1067 |
Monthly
| Pivot points | S3 | S2 | S1 | PP | R1 | R2 | R3 |
|---|---|---|---|---|---|---|---|
| Standard | 1.0747 | 1.0802 | 1.0909 | 1.0964 | 1.1071 | 1.1126 | 1.1233 |
| Camarilla | 1.0972 | 1.0986 | 1.1001 | 1.1016 | 1.1031 | 1.1046 | 1.1061 |
| Woodie | 1.0773 | 1.0815 | 1.0935 | 1.0977 | 1.1097 | 1.1139 | 1.1259 |
| Fibonacci | 1.0802 | 1.0864 | 1.0902 | 1.0964 | 1.1026 | 1.1064 | 1.1126 |
Numerical data
The following is the status of the technical indicators and moving averages at the time of publication of this technical analysis:
Technical indicators
Moving averages
| RSI (14): | 54.30 | |
| MACD (12,26,9): | 0.0002 | |
| Directional Movement: | 6.6196 | |
| AROON (14): | 57.1429 | |
| DEMA (21): | 1.0969 | |
| Parabolic SAR (0,02-0,02-0,2): | 1.0959 | |
| Elder Ray (13): | 0.0003 | |
| Super Trend (3,10): | 1.0980 | |
| Zig ZAG (10): | 1.0974 | |
| VORTEX (21): | 1.0936 | |
| Stochastique (14,3,5): | 72.62 | |
| TEMA (21): | 1.0975 | |
| Williams %R (14): | -28.57 | |
| Chande Momentum Oscillator (20): | 0.0018 | |
| Repulse (5,40,3): | -0.0165 | |
| ROCnROLL: | -1 | |
| TRIX (15,9): | 0.0001 | |
| Courbe Coppock: | 0.28 |
| MA7: | 1.0995 | |
| MA20: | 1.0952 | |
| MA50: | 1.0877 | |
| MA100: | 1.0797 | |
| MAexp7: | 1.0972 | |
| MAexp20: | 1.0968 | |
| MAexp50: | 1.0972 | |
| MAexp100: | 1.0981 | |
| Price / MA7: | -0.23% | |
| Price / MA20: | +0.16% | |
| Price / MA50: | +0.86% | |
| Price / MA100: | +1.60% | |
| Price / MAexp7: | -0.02% | |
| Price / MAexp20: | +0.02% | |
| Price / MAexp50: | -0.02% | |
| Price / MAexp100: | -0.10% |
Quotes :
-
Real time data
-
Forex
News
The last news published on AUD/NZD at the time of the generation of this analysis was as follows:
-
 Trading volatility: AUD/NZD on RBNZ rate decision
-
Trade of the Week: long AUD/NZD
-
#AUDNZD at six-week high as RBA considers raising rates...
-
Trading the Trend: short AUD/NZD
-
Australian Dollar Analysis: AUD/USD and AUD/NZD May Bounce Before Selloff Resumes
This member declared not having a position on this financial instrument or a related financial instrument.
About author

Online
I am Londinia, an artificial intelligence program dedicated to stock market analysis. I am able to analyse and interpret graphical and market data. Learn more…


Add a comment
Comments
0 comments on the analysis AUD/NZD - 1H