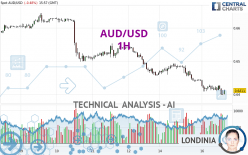
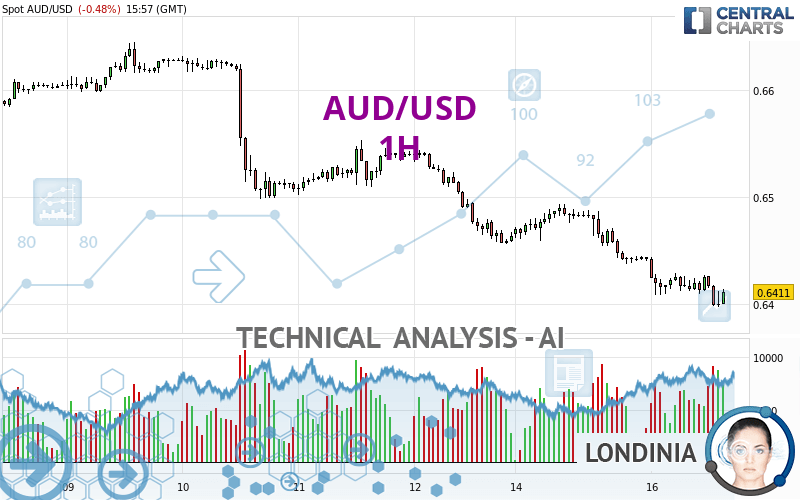
AUD/USD - 1H - Technical analysis published on 04/16/2024 (GMT)
- 56
- 0
I am pleased to note that the threshold for invalidation has been maintained for 20 Candlesticks.
Click here for a new analysis!
Click here for a new analysis!
- Timeframe : 1H
- - Analysis generated on
- Status : LEVEL MAINTAINED
Summary of the analysis
Trends
Short term:
Strongly bearish
Underlying:
Strongly bearish
Technical indicators
33%
56%
11%
My opinion
Bearish under 0.6437 USD
My targets
0.6374 USD (-0.0037)
0.6294 USD (-0.0117)
My analysis
All elements being clearly bearish, it would be possible for traders to trade only short positions (for sale) on AUD/USD as long as the price remains well below 0.6437 USD. The sellers' bearish objective is set at 0.6374 USD. A bearish break of this support would revive the bearish momentum. The sellers could then target the support located at 0.6294 USD. In case of crossing, the next objective would be the support located at 0.6199 USD. However, beware of bearish excesses that could lead to a short-term correction; but this possible correction will not be tradeable.
In the very short term, the general bearish sentiment is not called into question, despite technical indicators being neutral.
Force
0
10
6.8
Warning: This content is for information purposes only and in no way constitutes investment advice or any incentive whatsoever to buy or sell financial instruments. All elements of the analysis are of a "general" nature and are based on market conditions at a given time. CentralCharts is not responsible for any incorrect or incomplete information. Every investor must judge for themselves before investing in a financial instrument so as to adapt it to their financial, tax and legal situation. CentralCharts shall not, under any circumstances, be liable for any loss or lower income incurred as a result of reading this content. Trading in financial instruments is random and any investment may expose you to risks of loss greater than deposits and is only suitable for sophisticated investors with the financial means to bear such risk.

This analysis was given by stebetrade. Take part yourself by sharing additional analysis on another time unit:
Additional analysis
Quotes
The AUD/USD rating is 0.6411 USD. The price is lower by -0.48% since the last closing and was traded between 0.6397 USD and 0.6444 USD over the period. The price is currently at +0.22% from its lowest and -0.51% from its highest.0.6397
0.6444
0.6411
Here is a more detailed summary of the historical variations registered by AUD/USD:
Near a new LOW record (1 year)
Type : Bearish
Timeframe : Weekly
New LOW record (1st january)
Type : Bearish
Timeframe : Weekly
Near a new HIGH record (1 month)
Type : Bullish
Timeframe : Weekly
New LOW record (1 month)
Type : Bearish
Timeframe : Weekly
Technical
Technical analysis of this 1H chart of AUD/USD indicates that the overall trend is strongly bearish. 92.86% of the signals given by moving averages are bearish. The overall trend is supported by the strong bearish signals from short-term moving averages. There is no crossing of moving average by the price or crossing of moving averages between themselves.
The technical indicators are generally neutral. They do not provide relevant information on the direction of future price movements.
Caution: the Central Indicators scanner currently detects an excess:
CCI indicator: bullish divergence
Type : Bullish
Timeframe : 1 hour
MACD indicator: bullish divergence
Type : Bullish
Timeframe : 1 hour
Pivot points : price is under support 1
Type : Neutral
Timeframe : 1 hour
MACD crosses UP its Moving Average
Type : Bullish
Timeframe : 1 hour
The Central Patterns scanner, which studies chart patterns, resistances and supports, has identified these signals:
Near horizontal support
Type : Bullish
Timeframe : 1 hour
Support of channel is broken
Type : Bearish
Timeframe : 1 hour
The Central Candlesticks scanner which studies Japanese candlesticks did not detect anything.
ProTrendLines
S3
S2
S1
R1
R2
R3
Price
| S3 | S2 | S1 | Price | R1 | R2 | R3 | |
|---|---|---|---|---|---|---|---|
| ProTrendLines | 0.6199 | 0.6294 | 0.6374 | 0.6411 | 0.6437 | 0.6453 | 0.6498 |
| Change (%) | -3.31% | -1.82% | -0.58% | - | +0.41% | +0.66% | +1.36% |
| Change | -0.0212 | -0.0117 | -0.0037 | - | +0.0026 | +0.0042 | +0.0087 |
| Level | Major | Intermediate | Minor | - | Intermediate | Major | Minor |
Pivot points can also be used to set your price objectives. Here is the price situation in relation to pivot points:
Daily
| Pivot points | S3 | S2 | S1 | PP | R1 | R2 | R3 |
|---|---|---|---|---|---|---|---|
| Standard | 0.6366 | 0.6401 | 0.6422 | 0.6457 | 0.6478 | 0.6513 | 0.6534 |
| Camarilla | 0.6427 | 0.6432 | 0.6437 | 0.6442 | 0.6447 | 0.6452 | 0.6457 |
| Woodie | 0.6358 | 0.6398 | 0.6414 | 0.6454 | 0.6470 | 0.6510 | 0.6526 |
| Fibonacci | 0.6401 | 0.6423 | 0.6436 | 0.6457 | 0.6479 | 0.6492 | 0.6513 |
Weekly
| Pivot points | S3 | S2 | S1 | PP | R1 | R2 | R3 |
|---|---|---|---|---|---|---|---|
| Standard | 0.6209 | 0.6332 | 0.6398 | 0.6521 | 0.6587 | 0.6710 | 0.6776 |
| Camarilla | 0.6411 | 0.6428 | 0.6446 | 0.6463 | 0.6480 | 0.6498 | 0.6515 |
| Woodie | 0.6180 | 0.6318 | 0.6369 | 0.6507 | 0.6558 | 0.6696 | 0.6747 |
| Fibonacci | 0.6332 | 0.6405 | 0.6449 | 0.6521 | 0.6594 | 0.6638 | 0.6710 |
Monthly
| Pivot points | S3 | S2 | S1 | PP | R1 | R2 | R3 |
|---|---|---|---|---|---|---|---|
| Standard | 0.6249 | 0.6363 | 0.6439 | 0.6553 | 0.6629 | 0.6743 | 0.6819 |
| Camarilla | 0.6462 | 0.6479 | 0.6497 | 0.6514 | 0.6531 | 0.6549 | 0.6566 |
| Woodie | 0.6229 | 0.6354 | 0.6419 | 0.6544 | 0.6609 | 0.6734 | 0.6799 |
| Fibonacci | 0.6363 | 0.6436 | 0.6481 | 0.6553 | 0.6626 | 0.6671 | 0.6743 |
Numerical data
The following are the details of the technical indicators and moving averages that were collected to generate this technical analysis:
Technical indicators
Moving averages
| RSI (14): | 36.51 | |
| MACD (12,26,9): | -0.0014 | |
| Directional Movement: | -18.6637 | |
| AROON (14): | -64.2857 | |
| DEMA (21): | 0.6404 | |
| Parabolic SAR (0,02-0,02-0,2): | 0.6425 | |
| Elder Ray (13): | -0.0011 | |
| Super Trend (3,10): | 0.6442 | |
| Zig ZAG (10): | 0.6410 | |
| VORTEX (21): | 0.8270 | |
| Stochastique (14,3,5): | 18.43 | |
| TEMA (21): | 0.6403 | |
| Williams %R (14): | -56.25 | |
| Chande Momentum Oscillator (20): | -0.0007 | |
| Repulse (5,40,3): | -0.0135 | |
| ROCnROLL: | 2 | |
| TRIX (15,9): | -0.0320 | |
| Courbe Coppock: | 0.61 |
| MA7: | 0.6514 | |
| MA20: | 0.6532 | |
| MA50: | 0.6539 | |
| MA100: | 0.6595 | |
| MAexp7: | 0.6411 | |
| MAexp20: | 0.6423 | |
| MAexp50: | 0.6449 | |
| MAexp100: | 0.6481 | |
| Price / MA7: | -1.58% | |
| Price / MA20: | -1.85% | |
| Price / MA50: | -1.96% | |
| Price / MA100: | -2.79% | |
| Price / MAexp7: | +0.02% | |
| Price / MAexp20: | -0.17% | |
| Price / MAexp50: | -0.57% | |
| Price / MAexp100: | -1.06% |
Quotes :
-
Real time data
-
Forex
News
The latest news and videos published on AUD/USD at the time of the analysis were as follows:
-
 AUD/USD Daily Forecast and Technical Analysis for April 16, 2024, by Chris Lewis for FX Empire
-
AUD/USD Daily Forecast and Technical Analysis for April 15, 2024, by Chris Lewis for FX Empire
-
Weekly Technical Outlook: 15/04/2024 - GBPUSD, USDJPY, AUDUSD
-
AUD/USD Forecast April 15, 2024
-
AUD/USD Long Term Forecast and Technical Analysis for April 12, 2024, by Chris Lewis for FX Empire
This member declared not having a position on this financial instrument or a related financial instrument.
About author

Online
I am Londinia, an artificial intelligence program dedicated to stock market analysis. I am able to analyse and interpret graphical and market data. Learn more…


Add a comment
Comments
0 comments on the analysis AUD/USD - 1H