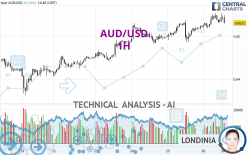
AUD/USD - 1H - Technical analysis published on 04/26/2024 (GMT)
- 96
- 0
Click here for a new analysis!
- Timeframe : 1H
- - Analysis generated on
- Status : TARGET REACHED

Summary of the analysis

Additional analysis
Quotes
AUD/USD rating 0.6531 USD. On the day, this instrument gained +0.14% and was between 0.6518 USD and 0.6554 USD. This implies that the price is at +0.20% from its lowest and at -0.35% from its highest.A study of price movements over other periods shows the following variations:
Near a new LOW record (1 year)
Type : Bearish
Timeframe : Weekly
Near a new HIGH record (1st january)
Type : Bullish
Timeframe : Weekly
Near a new LOW record (1 month)
Type : Bearish
Timeframe : Weekly
Technical
A technical analysis in 1H of this AUD/USD chart shows a bullish trend. 78.57% of the signals given by moving averages are bullish. Caution: the neutral signals currently given by the short-term moving averages indicate that this bullish trend is showing signs of running out of steam. The Central Indicators market scanner is currently detecting a bearish signal that could impact this trend:
Bearish price crossover with Moving Average 20
Type : Bearish
Timeframe : 1 hour
The technical indicators are generally neutral. They do not provide relevant information on the direction of future price movements.
Caution: the Central Indicators scanner currently detects an excess:
MACD indicator: bearish divergence
Type : Bearish
Timeframe : 1 hour
Pivot points : price is over resistance 1
Type : Neutral
Timeframe : Weekly
MACD crosses DOWN its Moving Average
Type : Bearish
Timeframe : 1 hour
Parabolic SAR indicator bearish reversal
Type : Bearish
Timeframe : 1 hour
Williams %R indicator is back under -50
Type : Bearish
Timeframe : 1 hour
An analysis of the price chart with the Central Patterns scanner (detector of chart patterns and resistances and supports) shows several results that can have an impact on the price change:
Near horizontal resistance
Type : Bearish
Timeframe : 1 hour
Resistance of channel is broken
Type : Bullish
Timeframe : 1 hour
The Central Candlesticks scanner, specialised in Japanese candlesticks, did not identify any signals.
| S3 | S2 | S1 | Price | R1 | R2 | R3 | |
|---|---|---|---|---|---|---|---|
| ProTrendLines | 0.6411 | 0.6456 | 0.6490 | 0.6531 | 0.6552 | 0.6631 | 0.6787 |
| Change (%) | -1.84% | -1.15% | -0.63% | - | +0.32% | +1.53% | +3.92% |
| Change | -0.0120 | -0.0075 | -0.0041 | - | +0.0021 | +0.0100 | +0.0256 |
| Level | Intermediate | Intermediate | Major | - | Intermediate | Major | Minor |
Attention could also be paid to pivot points to set price objectives:
| Pivot points | S3 | S2 | S1 | PP | R1 | R2 | R3 |
|---|---|---|---|---|---|---|---|
| Standard | 0.6438 | 0.6461 | 0.6492 | 0.6515 | 0.6546 | 0.6569 | 0.6600 |
| Camarilla | 0.6507 | 0.6512 | 0.6517 | 0.6522 | 0.6527 | 0.6532 | 0.6537 |
| Woodie | 0.6441 | 0.6463 | 0.6495 | 0.6517 | 0.6549 | 0.6571 | 0.6603 |
| Fibonacci | 0.6461 | 0.6482 | 0.6495 | 0.6515 | 0.6536 | 0.6549 | 0.6569 |
| Pivot points | S3 | S2 | S1 | PP | R1 | R2 | R3 |
|---|---|---|---|---|---|---|---|
| Standard | 0.6224 | 0.6293 | 0.6355 | 0.6424 | 0.6486 | 0.6555 | 0.6617 |
| Camarilla | 0.6381 | 0.6393 | 0.6405 | 0.6417 | 0.6429 | 0.6441 | 0.6453 |
| Woodie | 0.6221 | 0.6291 | 0.6352 | 0.6422 | 0.6483 | 0.6553 | 0.6614 |
| Fibonacci | 0.6293 | 0.6343 | 0.6374 | 0.6424 | 0.6474 | 0.6505 | 0.6555 |
| Pivot points | S3 | S2 | S1 | PP | R1 | R2 | R3 |
|---|---|---|---|---|---|---|---|
| Standard | 0.6249 | 0.6363 | 0.6439 | 0.6553 | 0.6629 | 0.6743 | 0.6819 |
| Camarilla | 0.6462 | 0.6479 | 0.6497 | 0.6514 | 0.6531 | 0.6549 | 0.6566 |
| Woodie | 0.6229 | 0.6354 | 0.6419 | 0.6544 | 0.6609 | 0.6734 | 0.6799 |
| Fibonacci | 0.6363 | 0.6436 | 0.6481 | 0.6553 | 0.6626 | 0.6671 | 0.6743 |
Numerical data
The following are the details of the technical indicators and moving averages that were collected to generate this technical analysis:
| RSI (14): | 55.35 | |
| MACD (12,26,9): | 0.0007 | |
| Directional Movement: | 13.3746 | |
| AROON (14): | 57.1429 | |
| DEMA (21): | 0.6542 | |
| Parabolic SAR (0,02-0,02-0,2): | 0.6533 | |
| Elder Ray (13): | 0.0006 | |
| Super Trend (3,10): | 0.6515 | |
| Zig ZAG (10): | 0.6534 | |
| VORTEX (21): | 1.1127 | |
| Stochastique (14,3,5): | 62.96 | |
| TEMA (21): | 0.6543 | |
| Williams %R (14): | -61.11 | |
| Chande Momentum Oscillator (20): | 0.0007 | |
| Repulse (5,40,3): | -0.2696 | |
| ROCnROLL: | -1 | |
| TRIX (15,9): | 0.0165 | |
| Courbe Coppock: | 0.53 |
| MA7: | 0.6476 | |
| MA20: | 0.6505 | |
| MA50: | 0.6533 | |
| MA100: | 0.6584 | |
| MAexp7: | 0.6538 | |
| MAexp20: | 0.6532 | |
| MAexp50: | 0.6518 | |
| MAexp100: | 0.6499 | |
| Price / MA7: | +0.85% | |
| Price / MA20: | +0.40% | |
| Price / MA50: | -0.03% | |
| Price / MA100: | -0.80% | |
| Price / MAexp7: | -0.09% | |
| Price / MAexp20: | -0% | |
| Price / MAexp50: | +0.21% | |
| Price / MAexp100: | +0.51% |
News
The latest news and videos published on AUD/USD at the time of the analysis were as follows:
-
 AUD/USD Long Term Forecast and Technical Analysis for April 26, 2024, by Chris Lewis for FX Empire
-
AUD/USD Daily Forecast and Technical Analysis for April 26, 2024, by Chris Lewis for FX Empire
-
AUD/USD Daily Forecast and Technical Analysis for April 25, 2024, by Chris Lewis for FX Empire
-
AUD/USD Forecast April 26, 2024
-
AUD/USD Daily Forecast and Technical Analysis for April 24, 2024, by Chris Lewis for FX Empire
About author

Online


Add a comment
Comments
0 comments on the analysis AUD/USD - 1H