AUD/USD - 1H - Technical analysis published on 04/30/2024 (GMT)
- 59
- 0
Click here for a new analysis!
- Timeframe : 1H
- - Analysis generated on
- Status : LEVEL MAINTAINED

Summary of the analysis

Additional analysis
Quotes
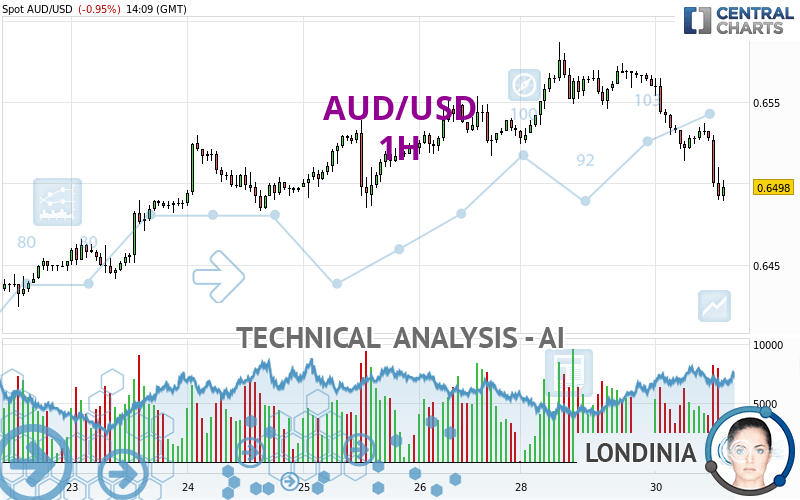
The AUD/USD rating is 0.6498 USD. The price registered a decrease of -0.95% on the session and was between 0.6489 USD and 0.6565 USD. This implies that the price is at +0.14% from its lowest and at -1.02% from its highest.So that you have an overall view of the price change, here is a table showing the variations over several periods:
Near a new LOW record (1 year)
Type : Bearish
Timeframe : Weekly
Near a new HIGH record (1st january)
Type : Bullish
Timeframe : Weekly
Near a new LOW record (1 month)
Type : Bearish
Timeframe : Weekly
Technical
A technical analysis in 1H of this AUD/USD chart shows a bearish trend. 78.57% of the signals given by moving averages are bearish. The overall trend is reinforced by the strong bearish signals from short-term moving averages. The Central Indicators scanner detects a bearish signal on moving averages that could impact this trend:
Bearish trend reversal : Moving Average 100
Type : Bearish
Timeframe : 1 hour
In fact, 13 technical indicators on 18 studied are currently bearish. Caution: the Central Indicators scanner currently detects an excess:
RSI indicator is oversold : under 30
Type : Neutral
Timeframe : 1 hour
CCI indicator is oversold : under -100
Type : Neutral
Timeframe : 1 hour
CCI indicator: bullish divergence
Type : Bullish
Timeframe : 1 hour
RSI indicator: bullish divergence
Type : Bullish
Timeframe : 1 hour
Williams %R indicator is oversold : under -80
Type : Neutral
Timeframe : 1 hour
Pivot points : price is under support 3
Type : Neutral
Timeframe : 1 hour
The Central Patterns scanner, which studies chart patterns, resistances and supports, has identified these signals:
Near horizontal support
Type : Bullish
Timeframe : 1 hour
Support of channel is broken
Type : Bearish
Timeframe : 1 hour
The Central Candlesticks scanner, specialised in Japanese candlesticks, did not identify any signals.
| S3 | S2 | S1 | Price | R1 | R2 | R3 | |
|---|---|---|---|---|---|---|---|
| ProTrendLines | 0.6411 | 0.6456 | 0.6498 | 0.6498 | 0.6530 | 0.6552 | 0.6587 |
| Change (%) | -1.34% | -0.65% | 0% | - | +0.49% | +0.83% | +1.37% |
| Change | -0.0087 | -0.0042 | 0 | - | +0.0032 | +0.0054 | +0.0089 |
| Level | Intermediate | Intermediate | Intermediate | - | Intermediate | Minor | Intermediate |
Attention could also be paid to pivot points to set price objectives:
| Pivot points | S3 | S2 | S1 | PP | R1 | R2 | R3 |
|---|---|---|---|---|---|---|---|
| Standard | 0.6464 | 0.6494 | 0.6527 | 0.6557 | 0.6590 | 0.6620 | 0.6653 |
| Camarilla | 0.6543 | 0.6549 | 0.6554 | 0.6560 | 0.6566 | 0.6572 | 0.6577 |
| Woodie | 0.6466 | 0.6495 | 0.6529 | 0.6558 | 0.6592 | 0.6621 | 0.6655 |
| Fibonacci | 0.6494 | 0.6518 | 0.6533 | 0.6557 | 0.6581 | 0.6596 | 0.6620 |
| Pivot points | S3 | S2 | S1 | PP | R1 | R2 | R3 |
|---|---|---|---|---|---|---|---|
| Standard | 0.6295 | 0.6351 | 0.6442 | 0.6498 | 0.6589 | 0.6645 | 0.6736 |
| Camarilla | 0.6493 | 0.6506 | 0.6520 | 0.6533 | 0.6547 | 0.6560 | 0.6573 |
| Woodie | 0.6313 | 0.6360 | 0.6460 | 0.6507 | 0.6607 | 0.6654 | 0.6754 |
| Fibonacci | 0.6351 | 0.6407 | 0.6442 | 0.6498 | 0.6554 | 0.6589 | 0.6645 |
| Pivot points | S3 | S2 | S1 | PP | R1 | R2 | R3 |
|---|---|---|---|---|---|---|---|
| Standard | 0.6249 | 0.6363 | 0.6439 | 0.6553 | 0.6629 | 0.6743 | 0.6819 |
| Camarilla | 0.6462 | 0.6479 | 0.6497 | 0.6514 | 0.6531 | 0.6549 | 0.6566 |
| Woodie | 0.6229 | 0.6354 | 0.6419 | 0.6544 | 0.6609 | 0.6734 | 0.6799 |
| Fibonacci | 0.6363 | 0.6436 | 0.6481 | 0.6553 | 0.6626 | 0.6671 | 0.6743 |
Numerical data
The following is the status of the technical indicators and moving averages at the time of publication of this technical analysis:
| RSI (14): | 23.39 | |
| MACD (12,26,9): | -0.0013 | |
| Directional Movement: | -30.8577 | |
| AROON (14): | -92.8571 | |
| DEMA (21): | 0.6514 | |
| Parabolic SAR (0,02-0,02-0,2): | 0.6534 | |
| Elder Ray (13): | -0.0027 | |
| Super Trend (3,10): | 0.6528 | |
| Zig ZAG (10): | 0.6492 | |
| VORTEX (21): | 0.6402 | |
| Stochastique (14,3,5): | 2.73 | |
| TEMA (21): | 0.6501 | |
| Williams %R (14): | -94.74 | |
| Chande Momentum Oscillator (20): | -0.0048 | |
| Repulse (5,40,3): | -0.3881 | |
| ROCnROLL: | 2 | |
| TRIX (15,9): | -0.0184 | |
| Courbe Coppock: | 1.36 |
| MA7: | 0.6507 | |
| MA20: | 0.6508 | |
| MA50: | 0.6533 | |
| MA100: | 0.6582 | |
| MAexp7: | 0.6511 | |
| MAexp20: | 0.6529 | |
| MAexp50: | 0.6537 | |
| MAexp100: | 0.6526 | |
| Price / MA7: | -0.14% | |
| Price / MA20: | -0.15% | |
| Price / MA50: | -0.54% | |
| Price / MA100: | -1.28% | |
| Price / MAexp7: | -0.18% | |
| Price / MAexp20: | -0.46% | |
| Price / MAexp50: | -0.58% | |
| Price / MAexp100: | -0.41% |
News
The last news published on AUD/USD at the time of the generation of this analysis was as follows:
-
 AUD/USD Daily Forecast and Technical Analysis for April 30, 2024, by Chris Lewis for FX Empire
-
AUD/USD Forecast April 30, 2024
-
AUD/USD Long Term Forecast and Technical Analysis for April 26, 2024, by Chris Lewis for FX Empire
-
AUD/USD Daily Forecast and Technical Analysis for April 26, 2024, by Chris Lewis for FX Empire
-
AUD/USD Daily Forecast and Technical Analysis for April 25, 2024, by Chris Lewis for FX Empire
About author

Online


Add a comment
Comments
0 comments on the analysis AUD/USD - 1H