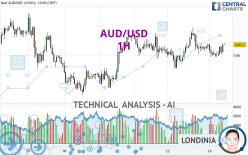
AUD/USD - 1H - Technical analysis published on 05/14/2024 (GMT)
- 52
- 0
Click here for a new analysis!
- Timeframe : 1H
- - Analysis generated on
- Status : TARGET REACHED

Summary of the analysis

Additional analysis
Quotes
AUD/USD rating 0.6611 USD. The price has increased by +0.00% since the last closing with the lowest point at 0.6598 USD and the highest point at 0.6612 USD. The deviation from the price is +0.20% for the low point and -0.02% for the high point.Here is a more detailed summary of the historical variations registered by AUD/USD:
Near a new LOW record (1 year)
Type : Bearish
Timeframe : Weekly
Near a new HIGH record (1st january)
Type : Bullish
Timeframe : Weekly
Near a new LOW record (1 month)
Type : Bearish
Timeframe : Weekly
Technical
Technical analysis of AUD/USD in 1H shows a strongly overall bullish trend. The signals given by moving averages are 82.14% bullish. This strongly bullish trend seems to be running out of steam given the signals being given by short-term moving averages. The Central Indicators scanner detects bullish signals on moving averages that could impact this trend:
Bullish price crossover with Moving Average 20
Type : Bullish
Timeframe : 1 hour
Bullish price crossover with Moving Average 50
Type : Bullish
Timeframe : 1 hour
Bullish price crossover with adaptative moving average 20
Type : Bullish
Timeframe : 1 hour
Bullish price crossover with adaptative moving average 100
Type : Bullish
Timeframe : 1 hour
The probability of a further increase are moderate given the direction of the technical indicators.
Caution: the Central Indicators scanner currently detects an excess:
MACD indicator: bullish divergence
Type : Bullish
Timeframe : 1 hour
Williams %R indicator is overbought : over -20
Type : Neutral
Timeframe : 1 hour
RSI indicator is back over 50
Type : Bullish
Timeframe : 1 hour
MACD crosses UP its Moving Average
Type : Bullish
Timeframe : 1 hour
Price is back over the pivot point
Type : Bullish
Timeframe : 1 hour
Price is back over the pivot point
Type : Bullish
Timeframe : Weekly
Momentum indicator is back over 0
Type : Bullish
Timeframe : 1 hour
An analysis of the price chart with the Central Patterns scanner (detector of chart patterns and resistances and supports) shows several results that can have an impact on the price change:
Near support of channel
Type : Bullish
Timeframe : 1 hour
Near support of triangle
Type : Bullish
Timeframe : 1 hour
Horizontal support is broken
Type : Bearish
Timeframe : 1 hour
The Central Candlesticks scanner, specialised in Japanese candlesticks, did not identify any signals.
| S3 | S2 | S1 | Price | R1 | R2 | R3 | |
|---|---|---|---|---|---|---|---|
| ProTrendLines | 0.6552 | 0.6586 | 0.6606 | 0.6611 | 0.6629 | 0.6650 | 0.6675 |
| Change (%) | -0.89% | -0.38% | -0.08% | - | +0.27% | +0.59% | +0.97% |
| Change | -0.0059 | -0.0025 | -0.0005 | - | +0.0018 | +0.0039 | +0.0064 |
| Level | Intermediate | Major | Minor | - | Major | Minor | Minor |
Attention could also be paid to pivot points to set price objectives:
| Pivot points | S3 | S2 | S1 | PP | R1 | R2 | R3 |
|---|---|---|---|---|---|---|---|
| Standard | 0.6545 | 0.6566 | 0.6588 | 0.6609 | 0.6631 | 0.6652 | 0.6674 |
| Camarilla | 0.6599 | 0.6603 | 0.6607 | 0.6611 | 0.6615 | 0.6619 | 0.6623 |
| Woodie | 0.6547 | 0.6566 | 0.6590 | 0.6609 | 0.6633 | 0.6652 | 0.6676 |
| Fibonacci | 0.6566 | 0.6582 | 0.6592 | 0.6609 | 0.6625 | 0.6635 | 0.6652 |
| Pivot points | S3 | S2 | S1 | PP | R1 | R2 | R3 |
|---|---|---|---|---|---|---|---|
| Standard | 0.6473 | 0.6515 | 0.6559 | 0.6601 | 0.6645 | 0.6687 | 0.6731 |
| Camarilla | 0.6578 | 0.6586 | 0.6594 | 0.6602 | 0.6610 | 0.6618 | 0.6626 |
| Woodie | 0.6473 | 0.6516 | 0.6559 | 0.6602 | 0.6645 | 0.6688 | 0.6731 |
| Fibonacci | 0.6515 | 0.6548 | 0.6569 | 0.6601 | 0.6634 | 0.6655 | 0.6687 |
| Pivot points | S3 | S2 | S1 | PP | R1 | R2 | R3 |
|---|---|---|---|---|---|---|---|
| Standard | 0.6060 | 0.6211 | 0.6343 | 0.6494 | 0.6626 | 0.6777 | 0.6909 |
| Camarilla | 0.6397 | 0.6423 | 0.6449 | 0.6475 | 0.6501 | 0.6527 | 0.6553 |
| Woodie | 0.6051 | 0.6206 | 0.6334 | 0.6489 | 0.6617 | 0.6772 | 0.6900 |
| Fibonacci | 0.6211 | 0.6319 | 0.6386 | 0.6494 | 0.6602 | 0.6669 | 0.6777 |
Numerical data
The following is the status of technical indicators and moving averages registered at the time this technical analysis was created:
| RSI (14): | 56.17 | |
| MACD (12,26,9): | 0.0000 | |
| Directional Movement: | 4.6075 | |
| AROON (14): | -14.2857 | |
| DEMA (21): | 0.6605 | |
| Parabolic SAR (0,02-0,02-0,2): | 0.6617 | |
| Elder Ray (13): | 0.0002 | |
| Super Trend (3,10): | 0.6620 | |
| Zig ZAG (10): | 0.6612 | |
| VORTEX (21): | 0.9048 | |
| Stochastique (14,3,5): | 71.43 | |
| TEMA (21): | 0.6604 | |
| Williams %R (14): | 0.00 | |
| Chande Momentum Oscillator (20): | 0.0005 | |
| Repulse (5,40,3): | 0.1850 | |
| ROCnROLL: | 1 | |
| TRIX (15,9): | -0.0011 | |
| Courbe Coppock: | 0.18 |
| MA7: | 0.6604 | |
| MA20: | 0.6537 | |
| MA50: | 0.6545 | |
| MA100: | 0.6572 | |
| MAexp7: | 0.6605 | |
| MAexp20: | 0.6606 | |
| MAexp50: | 0.6605 | |
| MAexp100: | 0.6600 | |
| Price / MA7: | +0.11% | |
| Price / MA20: | +1.13% | |
| Price / MA50: | +1.01% | |
| Price / MA100: | +0.59% | |
| Price / MAexp7: | +0.09% | |
| Price / MAexp20: | +0.08% | |
| Price / MAexp50: | +0.09% | |
| Price / MAexp100: | +0.17% |
News
The last news published on AUD/USD at the time of the generation of this analysis was as follows:
-
 AUD/USD Forecast May 14, 2024
-
AUD/USD Daily Forecast and Technical Analysis for May 13, 2024, by Chris Lewis for FX Empire
-
Weekly Technical Outlook: 13/05/2024 - EURUSD, GBPUSD, AUDUSD
-
AUD/USD Forecast May 13, 2024
-
AUD/USD Long Term Forecast and Technical Analysis for May 10, 2024, by Chris Lewis for FX Empire
About author

Online


Add a comment
Comments
0 comments on the analysis AUD/USD - 1H