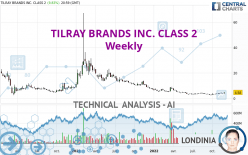
TILRAY BRANDS INC. - Weekly - Technical analysis published on 12/04/2022 (GMT)
- 187
- 0
Click here for a new analysis!
- Timeframe : Weekly
- - Analysis generated on
- Status : TARGET REACHED

Summary of the analysis

Additional analysis
Quotes
TILRAY BRANDS INC. CLASS 2 rating 4.58 USD. The price is up +18.96% over 5 days and was traded between 3.66 USD and 4.72 USD over the period. The price is currently at +25.14% from its lowest point and -2.97% from its highest point.The Central Gaps scanner detects a bearish opening. A small advantage for sellers in the very short term.
Bearish opening
Type : Bearish
Timeframe : Openning
So that you have an overall view of the price change, here is a table showing the variations over several periods:
New HIGH record (1 month)
Type : Bullish
Timeframe : Weekly
Technical
Technical analysis of TILRAY BRANDS INC. CLASS 2 in Weekly shows an overall bearish trend. 71.43% of the signals given by moving averages are bearish. Caution: the neutral signals currently given by short-term moving averages show us that the global trend is losing momentum. The Central Indicators market scanner is currently detecting several bullish signals that could impact this trend:
Bullish price crossover with adaptative moving average 20
Type : Bullish
Timeframe : Weekly
Bullish price crossover with adaptative moving average 50
Type : Bullish
Timeframe : Weekly
In fact, 14 technical indicators on 18 studied are currently positioned bullish. But beware of excesses. The Central Indicators scanner currently detects this:
CCI indicator is overbought : over 100
Type : Neutral
Timeframe : Weekly
Williams %R indicator is overbought : over -20
Type : Neutral
Timeframe : Weekly
Pivot points : price is over resistance 3
Type : Neutral
Timeframe : Weekly
RSI indicator is back over 50
Type : Bullish
Timeframe : Weekly
Aroon indicator bullish trend
Type : Bullish
Timeframe : Weekly
Ichimoku - Bullish crossover : Tenkan & Kijun
Type : Bullish
Timeframe : Weekly
Central Patterns, the scanner specializing in chart patterns, did not identify any signals.
The Central Candlesticks scanner which studies Japanese candlesticks did not detect anything.
| S1 | Price | R1 | R2 | R3 | |
|---|---|---|---|---|---|
| ProTrendLines | 4.52 | 4.58 | 34.66 | 50.45 | 63.91 |
| Change (%) | -1.31% | - | +656.77% | +1,001.53% | +1,295.41% |
| Change | -0.06 | - | +30.08 | +45.87 | +59.33 |
| Level | Major | - | Minor | Minor | Major |
Attention could also be paid to pivot points to set price objectives:
| Pivot points | S3 | S2 | S1 | PP | R1 | R2 | R3 |
|---|---|---|---|---|---|---|---|
| Standard | 3.44 | 3.73 | 4.15 | 4.44 | 4.86 | 5.15 | 5.57 |
| Camarilla | 4.39 | 4.45 | 4.52 | 4.58 | 4.65 | 4.71 | 4.78 |
| Woodie | 3.52 | 3.76 | 4.23 | 4.47 | 4.94 | 5.18 | 5.65 |
| Fibonacci | 3.73 | 4.00 | 4.17 | 4.44 | 4.71 | 4.88 | 5.15 |
| Pivot points | S3 | S2 | S1 | PP | R1 | R2 | R3 |
|---|---|---|---|---|---|---|---|
| Standard | 3.38 | 3.48 | 3.67 | 3.77 | 3.96 | 4.06 | 4.25 |
| Camarilla | 3.77 | 3.80 | 3.82 | 3.85 | 3.88 | 3.90 | 3.93 |
| Woodie | 3.42 | 3.50 | 3.71 | 3.79 | 4.00 | 4.08 | 4.29 |
| Fibonacci | 3.48 | 3.59 | 3.66 | 3.77 | 3.88 | 3.95 | 4.06 |
| Pivot points | S3 | S2 | S1 | PP | R1 | R2 | R3 |
|---|---|---|---|---|---|---|---|
| Standard | 2.48 | 2.98 | 3.43 | 3.93 | 4.38 | 4.88 | 5.33 |
| Camarilla | 3.61 | 3.70 | 3.78 | 3.87 | 3.96 | 4.04 | 4.13 |
| Woodie | 2.45 | 2.97 | 3.40 | 3.92 | 4.35 | 4.87 | 5.30 |
| Fibonacci | 2.98 | 3.35 | 3.57 | 3.93 | 4.30 | 4.52 | 4.88 |
Numerical data
The following is the status of technical indicators and moving averages registered at the time this technical analysis was created:
| RSI (14): | 56.04 | |
| MACD (12,26,9): | -0.2400 | |
| Directional Movement: | 14.40 | |
| AROON (14): | 71.43 | |
| DEMA (21): | 3.34 | |
| Parabolic SAR (0,02-0,02-0,2): | 2.94 | |
| Elder Ray (13): | 0.41 | |
| Super Trend (3,10): | 4.79 | |
| Zig ZAG (10): | 4.58 | |
| VORTEX (21): | 1.0400 | |
| Stochastique (14,3,5): | 74.99 | |
| TEMA (21): | 4.01 | |
| Williams %R (14): | -6.76 | |
| Chande Momentum Oscillator (20): | 1.18 | |
| Repulse (5,40,3): | 22.7700 | |
| ROCnROLL: | -1 | |
| TRIX (15,9): | -1.6000 | |
| Courbe Coppock: | 14.74 |
| MA7: | 3.95 | |
| MA20: | 3.92 | |
| MA50: | 3.52 | |
| MA100: | 3.57 | |
| MAexp7: | 3.94 | |
| MAexp20: | 3.83 | |
| MAexp50: | 5.39 | |
| MAexp100: | 10.22 | |
| Price / MA7: | +15.95% | |
| Price / MA20: | +16.84% | |
| Price / MA50: | +30.11% | |
| Price / MA100: | +28.29% | |
| Price / MAexp7: | +16.24% | |
| Price / MAexp20: | +19.58% | |
| Price / MAexp50: | -15.03% | |
| Price / MAexp100: | -55.19% |
News
Don't forget to follow the news on TILRAY BRANDS INC. CLASS 2. At the time of publication of this analysis, the latest news was as follows:
- Tilray Launches ‘Take Back Control’ Platform to Provide Women With Free Medical Cannabis Resources
- ‘Potently Canadian' Cannabis Brand, CANACA, Launches New Products and #FeelTheBoost Campaign
- Tilray Brands Acquires Montauk Brewing Company
- Leading Independent Proxy Advisory Firms ISS and Glass Lewis Recommend Tilray Stockholders Vote “FOR” Tilray’s Proposal to Protect Stockholders and Promote Accountability
- Tilray Brands and Charlotte’s Web Announce Strategic Alliance in Canada
About author

Online


Add a comment
Comments
0 comments on the analysis TILRAY BRANDS INC. - Weekly