USD/JPY - USD/JPY Soared and Hit Our Recommended Target at 112.40 - 09/21/2017 (GMT)
- Who voted?
- 405
- 0
- Timeframe : Daily
USD/JPY Chart
Are you looking for opportunities in indices and forex?
DISCOVER LONDINIA OPPORTUNITIES...
DISCOVER LONDINIA OPPORTUNITIES...
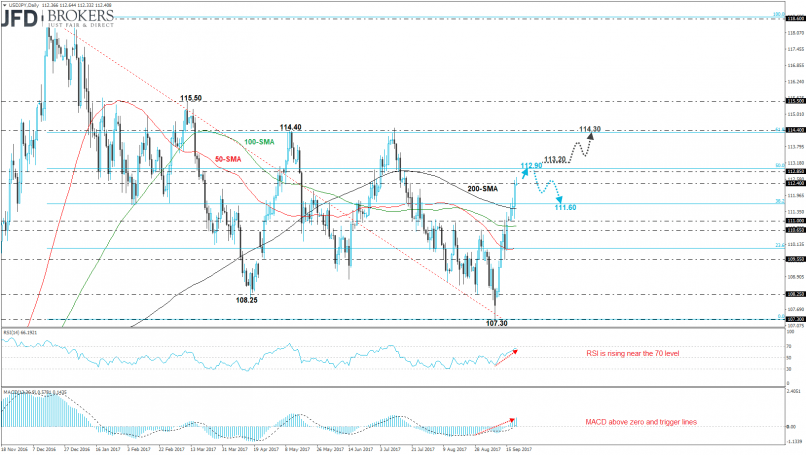
The U.S. dollar edged sharply higher against the Japanese yen, challenging the 112.65 price level, which is a two-month high. The USD/JPY pair surpassed our recommended target at 112.40 (see technical analysis here: http://bit.ly/2jJmAjy) and surged almost 2% over the last four days, posting three green days in a row.
Furthermore, on the daily timeframe, the price jumped above the three simple moving averages (50, 100 and 200) indicating for further gains towards the 50.0% Fibonacci retracement level with high at 118.60 and low at 107.30, near the 112.85 resistance barrier. After that, we are waiting for a small correction to the downside. The Relative Strength Index (RSI) is rising in the positive path, whilst the MACD oscillator lies above the trigger and zero lines.
Furthermore, on the daily timeframe, the price jumped above the three simple moving averages (50, 100 and 200) indicating for further gains towards the 50.0% Fibonacci retracement level with high at 118.60 and low at 107.30, near the 112.85 resistance barrier. After that, we are waiting for a small correction to the downside. The Relative Strength Index (RSI) is rising in the positive path, whilst the MACD oscillator lies above the trigger and zero lines.
This member declared not having a position on this financial instrument or a related financial instrument.
About author

Offline


Add a comment
Comments
0 comments on the analysis USD/JPY - Daily