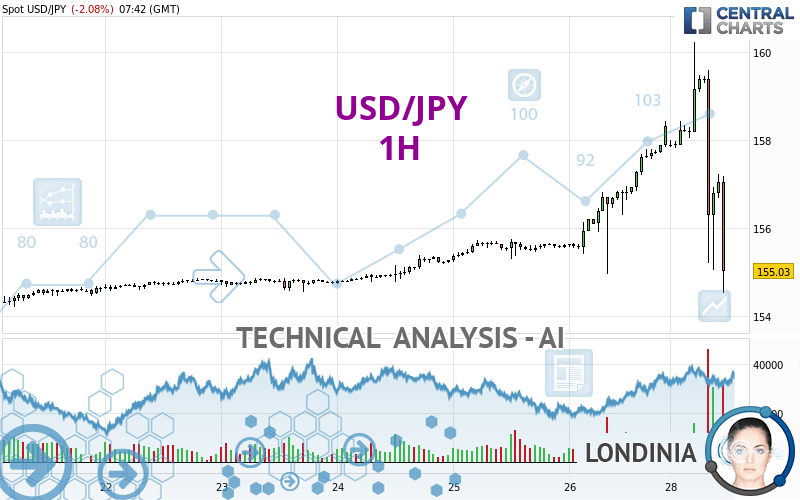
USD/JPY - 1H - Technical analysis published on 04/29/2024 (GMT)
- 74
- 0
Click here for a new analysis!
- Timeframe : 1H
- - Analysis generated on
- Status : INVALID
Summary of the analysis

Additional analysis
Quotes
USD/JPY rating 155.03 JPY. On the day, this instrument lost -2.08% and was between 154.53 JPY and 160.23 JPY. This implies that the price is at +0.32% from its lowest and at -3.25% from its highest.The Central Gaps scanner detects a bearish opening marking the presence of sellers ahead of buyers at the opening but not sufficiently marked to allow the price to register a quotation gap.
Bearish opening
Type : Bearish
Timeframe : Openning
So that you have an overall view of the price change, here is a table showing the variations over several periods:
New HIGH record (5 years)
Type : Bullish
Timeframe : Weekly
New HIGH record (1 year)
Type : Bullish
Timeframe : Weekly
New HIGH record (1st january)
Type : Bullish
Timeframe : Weekly
New HIGH record (1 month)
Type : Bullish
Timeframe : Weekly
Technical
Technical analysis of this 1H chart of USD/JPY indicates that the overall trend is slightly bearish. 60.71% of the signals given by moving averages are bearish. This slightly bearish trend could be reinforced by the strong bearish signals given by short-term moving averages. An assessment of moving averages reveals several bearish signals that could impact this trend:
Bearish price crossover with Moving Average 50
Type : Bearish
Timeframe : 1 hour
Bearish price crossover with Moving Average 100
Type : Bearish
Timeframe : 1 hour
In fact, only 9 technical indicators out of 18 studied are currently bearish. Caution: the Central Indicators scanner currently detects an excess:
CCI indicator is oversold : under -100
Type : Neutral
Timeframe : 1 hour
Williams %R indicator is oversold : under -80
Type : Neutral
Timeframe : 1 hour
Pivot points : price is under support 1
Type : Neutral
Timeframe : 1 hour
Pivot points : price is under support 1
Type : Neutral
Timeframe : Weekly
Ichimoku : price is under the cloud
Type : Bearish
Timeframe : 1 hour
The Central Patterns scanner, which studies chart patterns, resistances and supports, has identified this signal:
Near horizontal support
Type : Bullish
Timeframe : 1 hour
Central Candlesticks, the scanner specialised in Japanese candlesticks, detects these signals that could have an impact on the current short-term trend:
Doji
Type : Neutral
Timeframe : 1 hour
Long black line
Type : Bearish
Timeframe : 1 hour
| S3 | S2 | S1 | Price | R1 | R2 | |
|---|---|---|---|---|---|---|
| ProTrendLines | 151.64 | 153.59 | 154.70 | 155.03 | 155.31 | 155.75 |
| Change (%) | -2.19% | -0.93% | -0.21% | - | +0.18% | +0.46% |
| Change | -3.39 | -1.44 | -0.33 | - | +0.28 | +0.72 |
| Level | Major | Minor | Intermediate | - | Minor | Intermediate |
To determine price objectives, it is also possible to use the pivot points. Here is the price position in relation to pivot points:
| Pivot points | S3 | S2 | S1 | PP | R1 | R2 | R3 |
|---|---|---|---|---|---|---|---|
| Standard | 152.58 | 153.78 | 156.05 | 157.25 | 159.52 | 160.72 | 162.99 |
| Camarilla | 157.38 | 157.69 | 158.01 | 158.33 | 158.65 | 158.97 | 159.28 |
| Woodie | 153.13 | 154.05 | 156.60 | 157.52 | 160.07 | 160.99 | 163.54 |
| Fibonacci | 153.78 | 155.10 | 155.92 | 157.25 | 158.57 | 159.39 | 160.72 |
| Pivot points | S3 | S2 | S1 | PP | R1 | R2 | R3 |
|---|---|---|---|---|---|---|---|
| Standard | 151.73 | 153.10 | 155.71 | 157.08 | 159.69 | 161.06 | 163.67 |
| Camarilla | 157.24 | 157.60 | 157.97 | 158.33 | 158.70 | 159.06 | 159.43 |
| Woodie | 152.36 | 153.41 | 156.34 | 157.39 | 160.32 | 161.37 | 164.30 |
| Fibonacci | 153.10 | 154.62 | 155.56 | 157.08 | 158.60 | 159.54 | 161.06 |
| Pivot points | S3 | S2 | S1 | PP | R1 | R2 | R3 |
|---|---|---|---|---|---|---|---|
| Standard | 142.37 | 144.43 | 147.86 | 149.92 | 153.35 | 155.41 | 158.84 |
| Camarilla | 149.79 | 150.29 | 150.80 | 151.30 | 151.80 | 152.31 | 152.81 |
| Woodie | 143.07 | 144.77 | 148.56 | 150.26 | 154.05 | 155.75 | 159.54 |
| Fibonacci | 144.43 | 146.52 | 147.82 | 149.92 | 152.01 | 153.31 | 155.41 |
Numerical data
The following is the status of technical indicators and moving averages registered at the time this technical analysis was created:
| RSI (14): | 33.28 | |
| MACD (12,26,9): | 0.0500 | |
| Directional Movement: | -24.83 | |
| AROON (14): | -42.86 | |
| DEMA (21): | 157.64 | |
| Parabolic SAR (0,02-0,02-0,2): | 159.73 | |
| Elder Ray (13): | -1.26 | |
| Super Trend (3,10): | 158.85 | |
| Zig ZAG (10): | 155.13 | |
| VORTEX (21): | 0.9000 | |
| Stochastique (14,3,5): | 24.39 | |
| TEMA (21): | 157.28 | |
| Williams %R (14): | -99.04 | |
| Chande Momentum Oscillator (20): | -3.37 | |
| Repulse (5,40,3): | -1.8400 | |
| ROCnROLL: | 2 | |
| TRIX (15,9): | 0.0400 | |
| Courbe Coppock: | 0.43 |
| MA7: | 155.43 | |
| MA20: | 153.77 | |
| MA50: | 151.50 | |
| MA100: | 148.77 | |
| MAexp7: | 156.87 | |
| MAexp20: | 157.40 | |
| MAexp50: | 156.83 | |
| MAexp100: | 156.15 | |
| Price / MA7: | -0.26% | |
| Price / MA20: | +0.82% | |
| Price / MA50: | +2.33% | |
| Price / MA100: | +4.21% | |
| Price / MAexp7: | -1.17% | |
| Price / MAexp20: | -1.51% | |
| Price / MAexp50: | -1.15% | |
| Price / MAexp100: | -0.72% |
News
Don't forget to follow the news on USD/JPY. At the time of publication of this analysis, the latest news was as follows:
-
 USD/JPY Forecast April 29, 2024
-
USD/JPY Long Term Forecast and Technical Analysis for April 26, 2024, by Chris Lewis for FX Empire
-
USD/JPY Daily Forecast and Technical Analysis for April 26, 2024, by Chris Lewis for FX Empire
-
USD/JPY Daily Forecast and Technical Analysis for April 25, 2024, by Chris Lewis for FX Empire
-
USD/JPY Forecast April 25, 2024
About author

Online


Add a comment
Comments
0 comments on the analysis USD/JPY - 1H