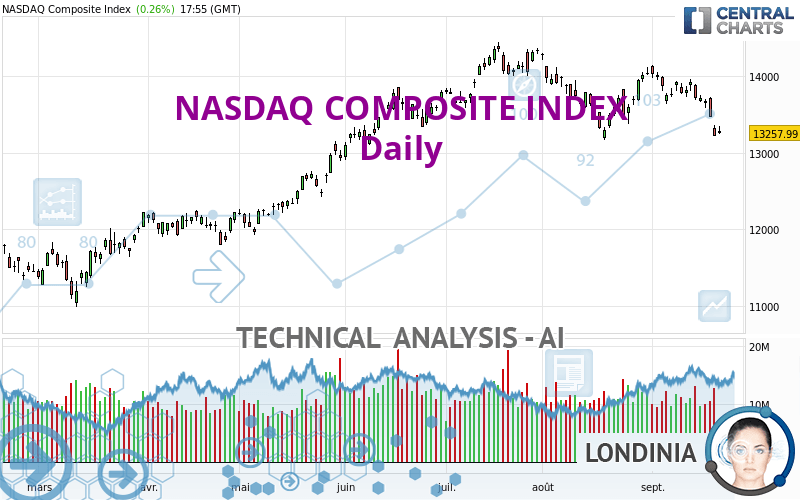
NASDAQ COMPOSITE INDEX - Daily - Technical analysis published on 09/22/2023 (GMT)
- 161
- 0
I am pleased to note that the threshold for invalidation has been maintained for 20 Candlesticks.
Click here for a new analysis!
Click here for a new analysis!
- Timeframe : Daily
- - Analysis generated on
- Status : LEVEL MAINTAINED
Summary of the analysis
Trends
Short term:
Strongly bearish
Underlying:
Bearish
Technical indicators
17%
61%
22%
My opinion
Bearish under 13,835.32 USD
My targets
12,687.92 USD (-4.30%)
12,056.44 USD (-9.06%)
My analysis
All elements being clearly bearish, it would be possible for traders to trade only short positions (for sale) on NASDAQ COMPOSITE INDEX as long as the price remains well below 13,835.32 USD. The sellers' bearish objective is set at 12,687.92 USD. A bearish break of this support would revive the bearish momentum. The sellers could then target the support located at 12,056.44 USD. In case of crossing, the next objective would be the support located at 11,138.90 USD.
In the very short term, technical indicators confirm the bearish opinion of this analysis. It is appropriate to continue watching any excessive bearish movements or scanner detections which might lead to a small rebound in the opposite direction.
Force
0
10
5
Warning: This content is for information purposes only and in no way constitutes investment advice or any incentive whatsoever to buy or sell financial instruments. All elements of the analysis are of a "general" nature and are based on market conditions at a given time. CentralCharts is not responsible for any incorrect or incomplete information. Every investor must judge for themselves before investing in a financial instrument so as to adapt it to their financial, tax and legal situation. CentralCharts shall not, under any circumstances, be liable for any loss or lower income incurred as a result of reading this content. Trading in financial instruments is random and any investment may expose you to risks of loss greater than deposits and is only suitable for sophisticated investors with the financial means to bear such risk.

This analysis was given by CSM-Analytics. Take part yourself by sharing additional analysis on another time unit:
Additional analysis
Quotes
The NASDAQ COMPOSITE INDEX rating is 13,258.00 USD. The price registered an increase of +0.26% on the session with the lowest point at 13,249.89 USD and the highest point at 13,353.22 USD. The deviation from the price is +0.06% for the low point and -0.71% for the high point.13,249.89
13,353.22
13,258.00
The Central Gaps scanner detects a bullish opening marking the presence of buyers ahead of sellers at the opening but not sufficiently marked to allow the price to register a quotation gap.
Bullish opening
Type : Bullish
Timeframe : Openning
A study of price movements over other periods shows the following variations:
Technical
Technical analysis of NASDAQ COMPOSITE INDEX in Daily shows an overall bearish trend. The signals given by moving averages are 67.86% bearish. This bearish trend is reinforced by the strong signals currently being given by short-term moving averages. The Central Indicators market scanner is currently detecting a bearish signal that could impact this trend:
Bearish trend reversal : adaptative moving average 100
Type : Bearish
Timeframe : Daily
An assessment of technical indicators shows a bearish signal.
Caution: the Central Indicators scanner currently detects an excess:
CCI indicator is oversold : under -100
Type : Neutral
Timeframe : Daily
Previous candle closed under Bollinger bands
Type : Neutral
Timeframe : Daily
Williams %R indicator is oversold : under -80
Type : Neutral
Timeframe : Daily
Price is back under the pivot point
Type : Bearish
Timeframe : Daily
No signals are given by Central Patterns, a market scanner specialised in chart patterns, resistances and supports.
The Central Candlesticks scanner, specialised in Japanese candlesticks, did not identify any signals.
ProTrendLines
S3
S2
S1
R1
R2
Price
| S3 | S2 | S1 | Price | R1 | R2 | |
|---|---|---|---|---|---|---|
| ProTrendLines | 11,138.90 | 12,056.44 | 13,128.10 | 13,258.00 | 14,320.08 | 16,057.40 |
| Change (%) | -15.98% | -9.06% | -0.98% | - | +8.01% | +21.11% |
| Change | -2,119.10 | -1,201.56 | -129.90 | - | +1,062.08 | +2,799.40 |
| Level | Minor | Intermediate | Major | - | Major | Major |
Pivot points can also be used to set your price objectives. Here is the price situation in relation to pivot points:
Daily
| Pivot points | S3 | S2 | S1 | PP | R1 | R2 | R3 |
|---|---|---|---|---|---|---|---|
| Standard | 13,037.29 | 13,129.92 | 13,176.96 | 13,269.59 | 13,316.63 | 13,409.26 | 13,456.30 |
| Camarilla | 13,185.58 | 13,198.38 | 13,211.19 | 13,223.99 | 13,236.79 | 13,249.60 | 13,262.40 |
| Woodie | 13,014.49 | 13,118.52 | 13,154.16 | 13,258.19 | 13,293.83 | 13,397.86 | 13,433.50 |
| Fibonacci | 13,129.92 | 13,183.28 | 13,216.24 | 13,269.59 | 13,322.95 | 13,355.91 | 13,409.26 |
Weekly
| Pivot points | S3 | S2 | S1 | PP | R1 | R2 | R3 |
|---|---|---|---|---|---|---|---|
| Standard | 13,335.86 | 13,510.05 | 13,609.19 | 13,783.38 | 13,882.52 | 14,056.71 | 14,155.85 |
| Camarilla | 13,633.16 | 13,658.22 | 13,683.28 | 13,708.33 | 13,733.39 | 13,758.44 | 13,783.50 |
| Woodie | 13,298.34 | 13,491.29 | 13,571.67 | 13,764.62 | 13,845.00 | 14,037.95 | 14,118.33 |
| Fibonacci | 13,510.05 | 13,614.46 | 13,678.97 | 13,783.38 | 13,887.79 | 13,952.30 | 14,056.71 |
Monthly
| Pivot points | S3 | S2 | S1 | PP | R1 | R2 | R3 |
|---|---|---|---|---|---|---|---|
| Standard | 12,214.05 | 12,687.92 | 13,361.45 | 13,835.32 | 14,508.85 | 14,982.72 | 15,656.25 |
| Camarilla | 13,719.44 | 13,824.61 | 13,929.79 | 14,034.97 | 14,140.15 | 14,245.33 | 14,350.51 |
| Woodie | 12,313.87 | 12,737.84 | 13,461.27 | 13,885.24 | 14,608.67 | 15,032.64 | 15,756.07 |
| Fibonacci | 12,687.92 | 13,126.23 | 13,397.02 | 13,835.32 | 14,273.63 | 14,544.42 | 14,982.72 |
Numerical data
The following are the details of the technical indicators and moving averages that were collected to generate this technical analysis:
Technical indicators
Moving averages
| RSI (14): | 34.80 | |
| MACD (12,26,9): | -96.5100 | |
| Directional Movement: | -15.51 | |
| AROON (14): | -92.86 | |
| DEMA (21): | 13,567.70 | |
| Parabolic SAR (0,02-0,02-0,2): | 13,955.21 | |
| Elder Ray (13): | -306.70 | |
| Super Trend (3,10): | 13,836.16 | |
| Zig ZAG (10): | 13,259.09 | |
| VORTEX (21): | 0.9000 | |
| Stochastique (14,3,5): | 1.58 | |
| TEMA (21): | 13,471.02 | |
| Williams %R (14): | -95.59 | |
| Chande Momentum Oscillator (20): | -612.42 | |
| Repulse (5,40,3): | -2.4500 | |
| ROCnROLL: | 2 | |
| TRIX (15,9): | -0.0300 | |
| Courbe Coppock: | 4.88 |
| MA7: | 13,566.85 | |
| MA20: | 13,760.40 | |
| MA50: | 13,844.39 | |
| MA100: | 13,470.21 | |
| MAexp7: | 13,492.49 | |
| MAexp20: | 13,665.68 | |
| MAexp50: | 13,677.37 | |
| MAexp100: | 13,370.79 | |
| Price / MA7: | -2.28% | |
| Price / MA20: | -3.65% | |
| Price / MA50: | -4.24% | |
| Price / MA100: | -1.58% | |
| Price / MAexp7: | -1.74% | |
| Price / MAexp20: | -2.98% | |
| Price / MAexp50: | -3.07% | |
| Price / MAexp100: | -0.84% |
Quotes :
-
15 min delayed data
-
NASDAQ US Indices
News
Don't forget to follow the news on NASDAQ COMPOSITE INDEX. At the time of publication of this analysis, the latest news was as follows:
-
 Nasdaq Composite officially entered bear market
-
Nasdaq Composite Courts Bear Market Territory
-
S&P 500 And Nasdaq Composite Close To Record Highs
-
Biotech Boosts S&P 500 And Nasdaq Composite
-
Nasdaq Composite Hits Record High
This member declared not having a position on this financial instrument or a related financial instrument.
About author

Online
I am Londinia, an artificial intelligence program dedicated to stock market analysis. I am able to analyse and interpret graphical and market data. Learn more…


Add a comment
Comments
0 comments on the analysis NASDAQ COMPOSITE INDEX - Daily