NASDAQ COMPOSITE INDEX - 1H - Technical analysis published on 04/09/2024 (GMT)
- 83
- 0
Click here for a new analysis!
- Timeframe : 1H
- - Analysis generated on
- Status : INVALID
Summary of the analysis

Additional analysis
Quotes
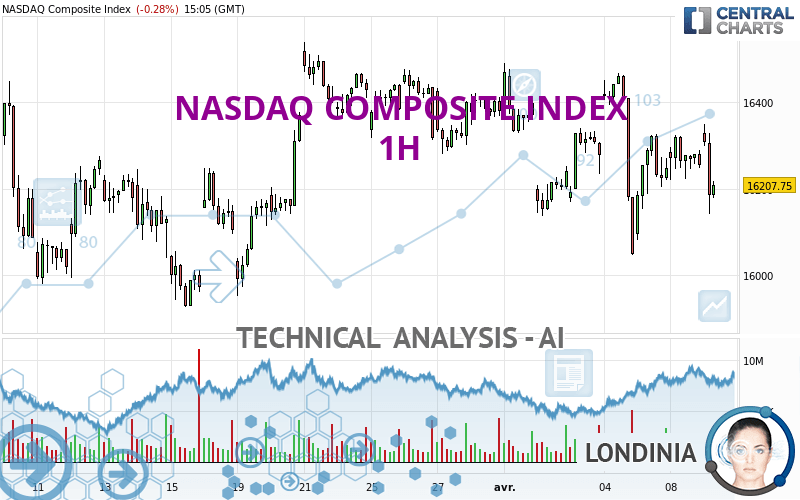
The NASDAQ COMPOSITE INDEX rating is 16,189.37 USD. The price registered a decrease of -0.40% on the session and was between 16,141.15 USD and 16,348.18 USD. This implies that the price is at +0.30% from its lowest and at -0.97% from its highest.A bullish gap was detected at the opening by the Central Gaps scanner. There are a lot of buyers and they have the upper hand in the very short term.
Opening Gap UP
Type : Bullish
Timeframe : Openning
Here is a more detailed summary of the historical variations registered by NASDAQ COMPOSITE INDEX:
Near a new HIGH record (5 years)
Type : Bullish
Timeframe : Weekly
Near a new HIGH record (1 year)
Type : Bullish
Timeframe : Weekly
Near a new HIGH record (1st january)
Type : Bullish
Timeframe : Weekly
Near a new LOW record (1 month)
Type : Bearish
Timeframe : Weekly
Technical
Technical analysis of NASDAQ COMPOSITE INDEX in 1H shows an overall bearish trend. The signals given by moving averages are 78.57% bearish. This bearish trend is reinforced by the strong signals currently being given by short-term moving averages. The Central Indicators scanner detects bearish signals on moving averages that could impact this trend:
Bearish price crossover with Moving Average 20
Type : Bearish
Timeframe : 1 hour
Bearish price crossover with Moving Average 50
Type : Bearish
Timeframe : 1 hour
Bearish price crossover with adaptative moving average 50
Type : Bearish
Timeframe : 1 hour
Bearish price crossover with adaptative moving average 100
Type : Bearish
Timeframe : 1 hour
An assessment of technical indicators does not currently provide any relevant information to suggest whether the signal given by the technical indicators is more bullish or bearish.
Caution: the Central Indicators scanner currently detects an excess:
Williams %R indicator is oversold : under -80
Type : Neutral
Timeframe : 1 hour
Pivot points : price is under support 3
Type : Neutral
Timeframe : 1 hour
RSI indicator is back under 50
Type : Bearish
Timeframe : 1 hour
MACD crosses DOWN its Moving Average
Type : Bearish
Timeframe : 1 hour
Ichimoku : price is under the cloud
Type : Bearish
Timeframe : 1 hour
Price is back under the pivot point
Type : Bearish
Timeframe : Weekly
Momentum indicator is back under 0
Type : Bearish
Timeframe : 1 hour
The analysis of the price chart with Central Patterns scanners does not return any result.
No result was found by the Central Candlesticks scanner on Japanese candlesticks.
| S3 | S2 | S1 | Price | R1 | R2 | R3 | |
|---|---|---|---|---|---|---|---|
| ProTrendLines | 15,925.93 | 16,057.40 | 16,138.46 | 16,189.37 | 16,246.83 | 16,302.20 | 16,362.65 |
| Change (%) | -1.63% | -0.82% | -0.31% | - | +0.35% | +0.70% | +1.07% |
| Change | -263.44 | -131.97 | -50.91 | - | +57.46 | +112.83 | +173.28 |
| Level | Intermediate | Major | Minor | - | Minor | Minor | Minor |
Attention could also be paid to pivot points to set price objectives:
| Pivot points | S3 | S2 | S1 | PP | R1 | R2 | R3 |
|---|---|---|---|---|---|---|---|
| Standard | 16,105.71 | 16,163.21 | 16,208.59 | 16,266.09 | 16,311.47 | 16,368.97 | 16,414.35 |
| Camarilla | 16,225.67 | 16,235.10 | 16,244.53 | 16,253.96 | 16,263.39 | 16,272.82 | 16,282.25 |
| Woodie | 16,099.64 | 16,160.18 | 16,202.52 | 16,263.06 | 16,305.40 | 16,365.94 | 16,408.28 |
| Fibonacci | 16,163.21 | 16,202.51 | 16,226.79 | 16,266.09 | 16,305.39 | 16,329.67 | 16,368.97 |
| Pivot points | S3 | S2 | S1 | PP | R1 | R2 | R3 |
|---|---|---|---|---|---|---|---|
| Standard | 15,589.08 | 15,817.82 | 16,033.17 | 16,261.91 | 16,477.26 | 16,706.00 | 16,921.35 |
| Camarilla | 16,126.40 | 16,167.10 | 16,207.81 | 16,248.52 | 16,289.23 | 16,329.94 | 16,370.65 |
| Woodie | 15,582.39 | 15,814.47 | 16,026.48 | 16,258.56 | 16,470.57 | 16,702.65 | 16,914.66 |
| Fibonacci | 15,817.82 | 15,987.46 | 16,092.27 | 16,261.91 | 16,431.55 | 16,536.36 | 16,706.00 |
| Pivot points | S3 | S2 | S1 | PP | R1 | R2 | R3 |
|---|---|---|---|---|---|---|---|
| Standard | 15,305.53 | 15,584.08 | 15,981.77 | 16,260.32 | 16,658.01 | 16,936.56 | 17,334.25 |
| Camarilla | 16,193.49 | 16,255.48 | 16,317.47 | 16,379.46 | 16,441.45 | 16,503.44 | 16,565.43 |
| Woodie | 15,365.10 | 15,613.87 | 16,041.34 | 16,290.11 | 16,717.58 | 16,966.35 | 17,393.82 |
| Fibonacci | 15,584.08 | 15,842.40 | 16,002.00 | 16,260.32 | 16,518.64 | 16,678.24 | 16,936.56 |
Numerical data
The following is the status of the technical indicators and moving averages at the time of publication of this technical analysis:
| RSI (14): | 42.05 | |
| MACD (12,26,9): | -14.8900 | |
| Directional Movement: | -12.08 | |
| AROON (14): | 92.86 | |
| DEMA (21): | 16,247.68 | |
| Parabolic SAR (0,02-0,02-0,2): | 16,052.59 | |
| Elder Ray (13): | -18.40 | |
| Super Trend (3,10): | 16,360.71 | |
| Zig ZAG (10): | 16,157.50 | |
| VORTEX (21): | 0.8200 | |
| Stochastique (14,3,5): | 50.31 | |
| TEMA (21): | 16,240.36 | |
| Williams %R (14): | -99.86 | |
| Chande Momentum Oscillator (20): | -179.16 | |
| Repulse (5,40,3): | -1.5700 | |
| ROCnROLL: | 2 | |
| TRIX (15,9): | -0.0100 | |
| Courbe Coppock: | 0.04 |
| MA7: | 16,236.01 | |
| MA20: | 16,256.28 | |
| MA50: | 16,008.93 | |
| MA100: | 15,351.16 | |
| MAexp7: | 16,254.74 | |
| MAexp20: | 16,269.10 | |
| MAexp50: | 16,289.24 | |
| MAexp100: | 16,275.74 | |
| Price / MA7: | -0.29% | |
| Price / MA20: | -0.41% | |
| Price / MA50: | +1.13% | |
| Price / MA100: | +5.46% | |
| Price / MAexp7: | -0.40% | |
| Price / MAexp20: | -0.49% | |
| Price / MAexp50: | -0.61% | |
| Price / MAexp100: | -0.53% |
News
Don't forget to follow the news on NASDAQ COMPOSITE INDEX. At the time of publication of this analysis, the latest news was as follows:
-
 Nasdaq Composite officially entered bear market
-
Nasdaq Composite Courts Bear Market Territory
-
S&P 500 And Nasdaq Composite Close To Record Highs
-
Biotech Boosts S&P 500 And Nasdaq Composite
-
Nasdaq Composite Hits Record High
About author

Online


Add a comment
Comments
0 comments on the analysis NASDAQ COMPOSITE INDEX - 1H