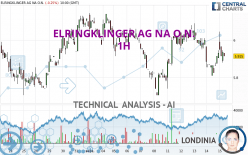
ELRINGKLINGER AG NA O.N. - 1H - Technical analysis published on 09/15/2023 (GMT)
- 163
- 0
Click here for a new analysis!
- Timeframe : 1H
- - Analysis generated on
- Status : TARGET REACHED

Summary of the analysis

Additional analysis
Quotes
ELRINGKLINGER AG NA O.N. rating 5.925 EUR. The price registered a decrease of -0.08% on the session and was between 5.880 EUR and 6.045 EUR. This implies that the price is at +0.77% from its lowest and at -1.99% from its highest.The Central Gaps scanner detects the formation of a bullish gap marking the strong presence of buyers against sellers at the opening. This formed a quotation gap.
Opening Gap UP
Type : Bullish
Timeframe : Openning
A study of price movements over other periods shows the following variations:
Near a new LOW record (1 year)
Type : Bearish
Timeframe : Weekly
Near a new LOW record (1st january)
Type : Bearish
Timeframe : Weekly
Near a new LOW record (1 month)
Type : Bearish
Timeframe : Weekly
Technical
Technical analysis of this 1H chart of ELRINGKLINGER AG NA O.N. indicates that the overall trend is bearish. 67.86% of the signals given by moving averages are bearish. Caution: as the signals currently given by short-term moving averages are rather neutral, the bearish trend could slow down. The Central Indicators scanner detects bullish and bearish signals on moving averages that could impact this trend:
Bearish trend reversal : adaptative moving average 20
Type : Bearish
Timeframe : 1 hour
Bullish price crossover with Moving Average 20
Type : Bullish
Timeframe : 1 hour
Bullish price crossover with Moving Average 50
Type : Bullish
Timeframe : 1 hour
Bullish price crossover with adaptative moving average 20
Type : Bullish
Timeframe : 1 hour
Bullish price crossover with adaptative moving average 50
Type : Bullish
Timeframe : 1 hour
In fact, only 8 technical indicators out of 18 studied are currently positioned bullish. Central Indicators, the detector scanner for these technical indicators has recently detected several signals:
RSI indicator is back over 50
Type : Bullish
Timeframe : 1 hour
Price is back over the pivot point
Type : Bullish
Timeframe : Weekly
Central Patterns, the market scanner focusing on chart patterns, resistances and supports found this result:
Near horizontal support
Type : Bullish
Timeframe : 1 hour
No result was found by the Central Candlesticks scanner on Japanese candlesticks.
| S3 | S2 | S1 | Price | R1 | R2 | R3 | |
|---|---|---|---|---|---|---|---|
| ProTrendLines | 5.752 | 5.855 | 5.917 | 5.925 | 6.010 | 6.089 | 6.142 |
| Change (%) | -2.92% | -1.18% | -0.14% | - | +1.43% | +2.77% | +3.66% |
| Change | -0.173 | -0.070 | -0.008 | - | +0.085 | +0.164 | +0.217 |
| Level | Major | Minor | Minor | - | Minor | Minor | Major |
Attention could also be paid to pivot points to set price objectives:
| Pivot points | S3 | S2 | S1 | PP | R1 | R2 | R3 |
|---|---|---|---|---|---|---|---|
| Standard | 5.683 | 5.747 | 5.838 | 5.902 | 5.993 | 6.057 | 6.148 |
| Camarilla | 5.887 | 5.902 | 5.916 | 5.930 | 5.944 | 5.958 | 5.973 |
| Woodie | 5.698 | 5.754 | 5.853 | 5.909 | 6.008 | 6.064 | 6.163 |
| Fibonacci | 5.747 | 5.806 | 5.843 | 5.902 | 5.961 | 5.998 | 6.057 |
| Pivot points | S3 | S2 | S1 | PP | R1 | R2 | R3 |
|---|---|---|---|---|---|---|---|
| Standard | 5.178 | 5.442 | 5.613 | 5.877 | 6.048 | 6.312 | 6.483 |
| Camarilla | 5.665 | 5.705 | 5.745 | 5.785 | 5.825 | 5.865 | 5.905 |
| Woodie | 5.133 | 5.419 | 5.568 | 5.854 | 6.003 | 6.289 | 6.438 |
| Fibonacci | 5.442 | 5.608 | 5.711 | 5.877 | 6.043 | 6.146 | 6.312 |
| Pivot points | S3 | S2 | S1 | PP | R1 | R2 | R3 |
|---|---|---|---|---|---|---|---|
| Standard | 3.098 | 4.402 | 5.238 | 6.542 | 7.378 | 8.682 | 9.518 |
| Camarilla | 5.487 | 5.683 | 5.879 | 6.075 | 6.271 | 6.467 | 6.664 |
| Woodie | 2.865 | 4.285 | 5.005 | 6.425 | 7.145 | 8.565 | 9.285 |
| Fibonacci | 4.402 | 5.219 | 5.724 | 6.542 | 7.359 | 7.864 | 8.682 |
Numerical data
The following is the status of technical indicators and moving averages registered at the time this technical analysis was created:
| RSI (14): | 46.79 | |
| MACD (12,26,9): | -0.0160 | |
| Directional Movement: | 2.771 | |
| AROON (14): | 35.714 | |
| DEMA (21): | 5.910 | |
| Parabolic SAR (0,02-0,02-0,2): | 5.844 | |
| Elder Ray (13): | -0.012 | |
| Super Trend (3,10): | 5.969 | |
| Zig ZAG (10): | 5.935 | |
| VORTEX (21): | 0.7300 | |
| Stochastique (14,3,5): | 52.48 | |
| TEMA (21): | 5.898 | |
| Williams %R (14): | -46.81 | |
| Chande Momentum Oscillator (20): | -0.065 | |
| Repulse (5,40,3): | -0.1100 | |
| ROCnROLL: | -1 | |
| TRIX (15,9): | -0.0390 | |
| Courbe Coppock: | 2.66 |
| MA7: | 5.928 | |
| MA20: | 5.934 | |
| MA50: | 6.783 | |
| MA100: | 7.832 | |
| MAexp7: | 5.917 | |
| MAexp20: | 5.925 | |
| MAexp50: | 5.940 | |
| MAexp100: | 5.958 | |
| Price / MA7: | -0.05% | |
| Price / MA20: | -0.15% | |
| Price / MA50: | -12.65% | |
| Price / MA100: | -24.35% | |
| Price / MAexp7: | +0.14% | |
| Price / MAexp20: | -0% | |
| Price / MAexp50: | -0.25% | |
| Price / MAexp100: | -0.55% |
News
The last news published on ELRINGKLINGER AG NA O.N. at the time of the generation of this analysis was as follows:
- EQS-News: New EKPO order marks first strategic step into the electrolysis market
- EQS-News: ElringKlinger with increased profitability in the first half of 2023
- EQS-News: ElringKlinger secures series production contract from global Tier 1 supplier for battery housings
- EQS-Adhoc: Q2 2023: Marked year-on-year improvement in revenue and earnings performance
- EQS-News: EKPO supplies fuel cell stacks for cruise ship
About author
Online


Add a comment
Comments
0 comments on the analysis ELRINGKLINGER AG NA O.N. - 1H