Analyses of Traders and financial instruments followed by Efthi Greg - Page 2
Sort : Latest comments | Latest posted
EUR/USD
> Analyses

 Thank you
Reply
Chart

Melina Deltas has published a new analysis.
- 90
- 836
- 1878
- 0

Timeframe : Daily - Simple chart
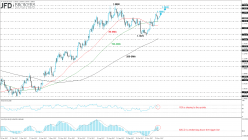
The world’s most traded currency pair – the EUR/USD – posted a neutral to positive day following two negative sessions. The price failed to extend its gains and rebounded on the 1.1960…
S&P500 INDEX
> Analyses

 Thank you
Reply
Chart

Melina Deltas has published a new analysis.
- 90
- 836
- 1878
- 0

Timeframe : Daily - Simple chart
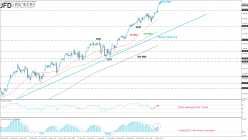
The S&P 500 index posted a fresh all-time high at 2627.38 on Tuesday and soared more than 6% following the bounce off the ascending trend line in August. Currently, the index is establishing an…
GBP/USD
> Analyses

 Thank you
Reply
Chart

Melina Deltas has published a new analysis.
- 90
- 836
- 1878
- 0

Timeframe : Daily - Simple chart
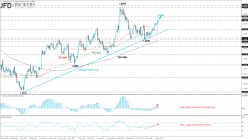
The cable had a strong rally during yesterday’s trading period as it had a strong spike to the downside before ending the day higher. The GBP/USD pair bounced off the 1.3220 support level and is…
NZD/USD
> Analyses

 Thank you
Reply
Chart

Melina Deltas has published a new analysis.
- 90
- 836
- 1878
- 0

Timeframe : Daily - Simple chart
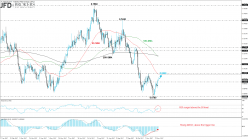
The NZD/USD pair extended its gains with aggressive mode after the rebound on the 0.6780 support level, 18-month low. The kiwi completed a green week against the greenback and soared almost 1%. Since…
GBP/USD
> Analyses

 Thank you
Reply
Chart

Melina Deltas has published a new analysis.
- 90
- 836
- 1878
- 0

Timeframe : Daily - Simple chart
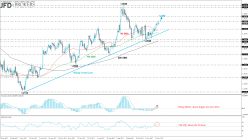
Sterling managed to challenge a seven-week high against the greenback on the back of Brexit news but nothing was announced the prior week. The GBP/USD pair surged more than 1.8% since November 5 after…
DOW JONES INDUSTRIAL AVERAGE > Analyses

 Thank you
Reply

Melina Deltas has published a new analysis.
- 90
- 836
- 1878
- 0

Timeframe : Daily - Simple chart
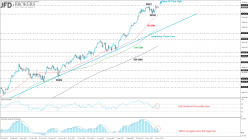
The Dow Jones Industrial Average index posted a fresh all-time high at 23623.50 during the previous week and soared more than 35% since January 2016. Currently, the price is developing within a…
APPLEGREEN ORD EUR0.01 > Analyses

 Thank you
Reply

Melina Deltas has published a new analysis.
- 90
- 836
- 1878
- 0

Timeframe : Daily - Simple chart
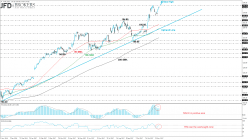
Apple (NASDAQ: AAPL) is the stock market’s largest company and has also become one of the biggest payers of dividend income to its investors. Apple raised its dividend in 2017, and investors believe…
EUR/GBP
> Analyses

 Thank you
Reply
Chart

Melina Deltas has published a new analysis.
- 90
- 836
- 1878
- 0

Timeframe : Daily - Simple chart
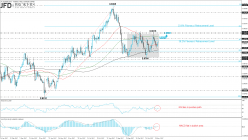
The EUR/GBP pair posted a bullish day, adding 0.4% to its performance after the aggressive selling interest from the 0.9015 resistance level. The currency pair is developing within a sideways channel…
GBP/USD
> Analyses

 Thank you
Reply
Chart

Melina Deltas has published a new analysis.
- 90
- 836
- 1878
- 0

Timeframe : Daily - Simple chart
The British pound is also holding in a consolidation area versus the U.S. dollar with resistance strong obstacle the 1.3320 and support handle the 1.3040 support level. During yesterday’s trading…
USD/JPY
> Analyses

 Thank you
Reply
Chart

Melina Deltas has published a new analysis.
- 90
- 836
- 1878
- 0

Timeframe : Daily - Simple chart
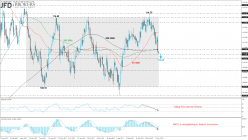
During yesterday’s trading period, the U.S. dollar slumped versus the Japanese yen and dropped more than 1.2% in just one daily session. The USD/JPY pair hit our recommended target at 111.65 (see…


