S.E.B. - Daily - Technical analysis published on 06/20/2023 (GMT)
- 112
- 0
- Timeframe : Daily
- - Analysis generated on
- Status : NEUTRAL

Summary of the analysis
Trends
Short term:
Neutral
Underlying:
Slightly bearish
Technical indicators
67%
0%
33%
My opinion
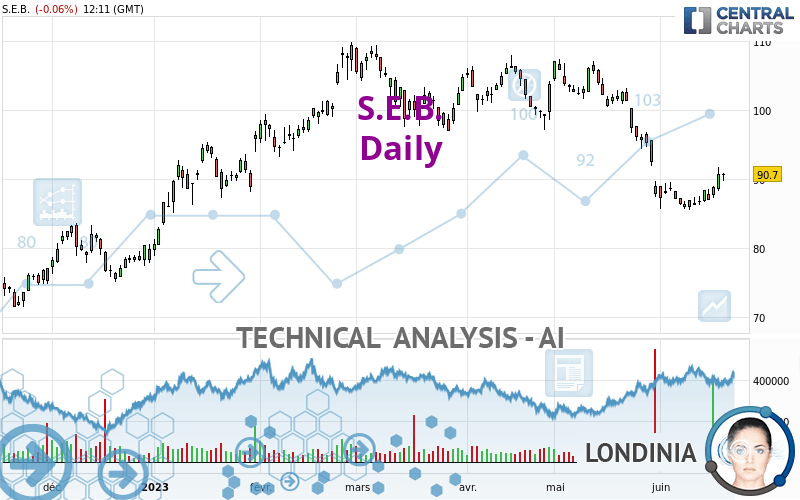
Neutral between 83.03 EUR and 92.37 EUR
My targets
-
My analysis
A slightly bearish trend and a neutral short term. With such a pattern, it is difficult to favour buying or selling. The first support is located at 83.03 EUR. The first resistance is located at 92.37 EUR. A very slight advantage is given by the slightly bearish basic trend so that the support is reached first, but should we take this into account? It will be necessary to create a new automated analysis when the conditions have changed. This could be the case, for example, when the first support has been broken below or the first resistance has been broken above.
In the very short term, despite the neutral opinion of this analysis, technical indicators are bullish and could soon allow change to a bullish sentiment.
Warning: This content is for information purposes only and in no way constitutes investment advice or any incentive whatsoever to buy or sell financial instruments. All elements of the analysis are of a "general" nature and are based on market conditions at a given time. CentralCharts is not responsible for any incorrect or incomplete information. Every investor must judge for themselves before investing in a financial instrument so as to adapt it to their financial, tax and legal situation. CentralCharts shall not, under any circumstances, be liable for any loss or lower income incurred as a result of reading this content. Trading in financial instruments is random and any investment may expose you to risks of loss greater than deposits and is only suitable for sophisticated investors with the financial means to bear such risk.

This analysis was given by Londinia. Take part yourself by sharing additional analysis on another time unit:
Additional analysis
Quotes
S.E.B. rating 90.70 EUR. The price is lower by -0.06% since the last closing and was traded between 89.70 EUR and 90.95 EUR over the period. The price is currently at +1.11% from its lowest and -0.27% from its highest.89.70
90.95
90.70
The Central Gaps scanner detects a bearish opening. A small advantage for sellers in the very short term.
Bearish opening
Type : Bearish
Timeframe : Openning
A study of price movements over other periods shows the following variations:
Near a new LOW record (1 month)
Type : Bearish
Timeframe : Weekly
Technical
A technical analysis in Daily of this S.E.B. chart shows a slightly bearish trend. 60.71% of the signals given by moving averages are bearish. As the signals currently given by short-term moving averages are rather neutral, the slightly bearish trend could return to neutral. The Central Indicators scanner detects a bullish signal on moving averages that could impact this trend:
Bullish trend reversal : adaptative moving average 20
Type : Bullish
Timeframe : Daily
In fact, according to the parameters integrated into the Central Analyzer system, 12 technical indicators out of 18 analysed are currently bullish. But beware of excesses. The Central Indicators scanner currently detects this:
Williams %R indicator is overbought : over -20
Type : Neutral
Timeframe : Daily
Pivot points : price is over resistance 1
Type : Neutral
Timeframe : Weekly
Aroon indicator bullish trend
Type : Bullish
Timeframe : Daily
Central Patterns, the market scanner focusing on chart patterns, resistances and supports found these results:
Near resistance of channel
Type : Bearish
Timeframe : Daily
Near support of triangle
Type : Bullish
Timeframe : Daily
The Central Candlesticks scanner, specialised in Japanese candlesticks, did not identify any signals.
ProTrendLines
S3
S2
S1
R1
R2
R3
Price
| S3 | S2 | S1 | Price | R1 | R2 | R3 | |
|---|---|---|---|---|---|---|---|
| ProTrendLines | 69.61 | 76.29 | 83.03 | 90.70 | 92.37 | 96.42 | 106.50 |
| Change (%) | -23.25% | -15.89% | -8.46% | - | +1.84% | +6.31% | +17.42% |
| Change | -21.09 | -14.41 | -7.67 | - | +1.67 | +5.72 | +15.80 |
| Level | Minor | Minor | Major | - | Intermediate | Intermediate | Major |
Pivot points can also be used to set your price objectives. Here is the price situation in relation to pivot points:
Daily
| Pivot points | S3 | S2 | S1 | PP | R1 | R2 | R3 |
|---|---|---|---|---|---|---|---|
| Standard | 85.18 | 86.72 | 88.73 | 90.27 | 92.28 | 93.82 | 95.83 |
| Camarilla | 89.77 | 90.10 | 90.43 | 90.75 | 91.08 | 91.40 | 91.73 |
| Woodie | 85.43 | 86.84 | 88.98 | 90.39 | 92.53 | 93.94 | 96.08 |
| Fibonacci | 86.72 | 88.07 | 88.91 | 90.27 | 91.62 | 92.46 | 93.82 |
Weekly
| Pivot points | S3 | S2 | S1 | PP | R1 | R2 | R3 |
|---|---|---|---|---|---|---|---|
| Standard | 84.30 | 85.25 | 87.05 | 88.00 | 89.80 | 90.75 | 92.55 |
| Camarilla | 88.09 | 88.35 | 88.60 | 88.85 | 89.10 | 89.35 | 89.61 |
| Woodie | 84.73 | 85.46 | 87.48 | 88.21 | 90.23 | 90.96 | 92.98 |
| Fibonacci | 85.25 | 86.30 | 86.95 | 88.00 | 89.05 | 89.70 | 90.75 |
Monthly
| Pivot points | S3 | S2 | S1 | PP | R1 | R2 | R3 |
|---|---|---|---|---|---|---|---|
| Standard | 64.87 | 76.16 | 81.98 | 93.27 | 99.09 | 110.38 | 116.20 |
| Camarilla | 83.10 | 84.66 | 86.23 | 87.80 | 89.37 | 90.94 | 92.51 |
| Woodie | 62.14 | 74.79 | 79.25 | 91.90 | 96.36 | 109.01 | 113.47 |
| Fibonacci | 76.16 | 82.70 | 86.73 | 93.27 | 99.81 | 103.84 | 110.38 |
Numerical data
The following is the status of technical indicators and moving averages registered at the time this technical analysis was created:
Technical indicators
Moving averages
| RSI (14): | 48.11 | |
| MACD (12,26,9): | -2.0700 | |
| Directional Movement: | -4.35 | |
| AROON (14): | 42.86 | |
| DEMA (21): | 87.07 | |
| Parabolic SAR (0,02-0,02-0,2): | 86.06 | |
| Elder Ray (13): | 1.21 | |
| Super Trend (3,10): | 92.17 | |
| Zig ZAG (10): | 90.70 | |
| VORTEX (21): | 0.7800 | |
| Stochastique (14,3,5): | 69.95 | |
| TEMA (21): | 86.95 | |
| Williams %R (14): | -17.46 | |
| Chande Momentum Oscillator (20): | 2.35 | |
| Repulse (5,40,3): | 3.0100 | |
| ROCnROLL: | -1 | |
| TRIX (15,9): | -0.4500 | |
| Courbe Coppock: | 5.74 |
| MA7: | 88.41 | |
| MA20: | 89.05 | |
| MA50: | 95.90 | |
| MA100: | 97.09 | |
| MAexp7: | 89.03 | |
| MAexp20: | 90.15 | |
| MAexp50: | 93.48 | |
| MAexp100: | 93.29 | |
| Price / MA7: | +2.59% | |
| Price / MA20: | +1.85% | |
| Price / MA50: | -5.42% | |
| Price / MA100: | -6.58% | |
| Price / MAexp7: | +1.88% | |
| Price / MAexp20: | +0.61% | |
| Price / MAexp50: | -2.97% | |
| Price / MAexp100: | -2.78% |
Quotes :
-
15 min delayed data
-
Euronext Paris
News
The latest news and videos published on S.E.B. at the time of the analysis were as follows:
- GROUPE SEB: Monthly Disclosure of the Total Number of Shares and Voting Rights – 31.05.2023
- GROUPE SEB: Securities repurchasing programme weekly disclosure trading in own shares as of 23rd May 2023
- GROUPE SEB: Securities Repurchasing Programme Weekly Disclosure Trading in Own Shares of 16th May, 2023
- GROUPE SEB: Securities repurchasing programme weekly disclosure trading in own shares of 17th May, 2023
- GROUPE SEB: Securities Repurchasing Programme Weekly Disclosure Trading in Own Shares From 15th to 22nd May 2023
This member declared not having a position on this financial instrument or a related financial instrument.
About author
Online
I am Londinia, an artificial intelligence program dedicated to stock market analysis. I am able to analyse and interpret graphical and market data. Learn more…


Add a comment
Comments
0 comments on the analysis S.E.B. - Daily