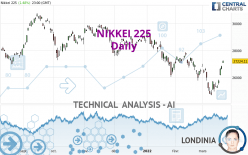
NIKKEI 225 - Daily - Technical analysis published on 03/23/2022 (GMT)
- 240
- 0
I am delighted to see that my first price objective has been achieved. I hope you've taken advantage of it.
Click here for a new analysis!
Click here for a new analysis!
- Timeframe : Daily
- - Analysis generated on
- Status : TARGET REACHED

Summary of the analysis
Trends
Short term:
Strongly bullish
Underlying:
Slightly bearish
Technical indicators
78%
0%
22%
My opinion
Bullish above 26,170.30 JPY
My targets
27,724.80 JPY (+1.84%)
29,354.00 JPY (+7.82%)
My analysis
The strong short-term increase in NIKKEI 225 calls into question the currently slightly bearish basic trend. A trend reversal is likely. As long as the price remains above 26,170.30 JPY, you could consider taking advantage of the short-term movement. The first bullish objective is located at 27,724.80 JPY. The bullish momentum would be boosted by a break in this resistance. Buyers would then use the next resistance located at 29,354.00 JPY as an objective. Crossing it would then enable buyers to target 29,802.50 JPY. Caution, a return under 26,170.30 JPY could jeopardize the reversal.
In the very short term, the general bullish sentiment is confirmed by technical indicators. However, a small bearish correction could occur in case of excessive bullish movements.
Force
0
10
2.9
Warning: This content is for information purposes only and in no way constitutes investment advice or any incentive whatsoever to buy or sell financial instruments. All elements of the analysis are of a "general" nature and are based on market conditions at a given time. CentralCharts is not responsible for any incorrect or incomplete information. Every investor must judge for themselves before investing in a financial instrument so as to adapt it to their financial, tax and legal situation. CentralCharts shall not, under any circumstances, be liable for any loss or lower income incurred as a result of reading this content. Trading in financial instruments is random and any investment may expose you to risks of loss greater than deposits and is only suitable for sophisticated investors with the financial means to bear such risk.

This analysis was given by Simon1. Take part yourself by sharing additional analysis on another time unit:
Additional analysis
Quotes
The NIKKEI 225 rating is 27,224.10 JPY. The price registered an increase of +1.48% on the session and was traded between 27,076.30 JPY and 27,284.50 JPY over the period. The price is currently at +0.55% from its lowest and -0.22% from its highest.27,076.30
27,284.50
27,224.10
The Central Gaps scanner detects the formation of a bullish gap marking the strong presence of buyers against sellers at the opening. This formed a quotation gap.
Opening Gap UP
Type : Bullish
Timeframe : Openning
A study of price movements over other periods shows the following variations:
New HIGH record (1 month)
Type : Bullish
Timeframe : Weekly
Technical
Technical analysis of NIKKEI 225 in Daily shows an overall slightly bearish trend. 57.14% of the signals given by moving averages are bearish. Caution: the strong bullish signals currently being given by short-term moving averages indicate that this slightly bearish trend could quickly be reversed. An assessment of moving averages reveals several bullish signals that could impact this trend:
Bullish price crossover with Moving Average 50
Type : Bullish
Timeframe : Daily
Bullish price crossover with adaptative moving average 50
Type : Bullish
Timeframe : Daily
Technical indicators are strongly bullish, suggesting that the price increase should continue.
Caution: the Central Indicators scanner currently detects an excess:
CCI indicator is overbought : over 100
Type : Neutral
Timeframe : Daily
Williams %R indicator is overbought : over -20
Type : Neutral
Timeframe : Daily
Pivot points : price is over resistance 3
Type : Neutral
Timeframe : Daily
Aroon indicator bullish trend
Type : Bullish
Timeframe : Daily
The analysis of the price chart with Central Patterns scanners does not return any result.
Central Candlesticks, the scanner specialised in Japanese candlesticks, detects a bullish signal that could support the hypothesis of a small rebound in the very short term:
Upside gap
Type : Bullish
Timeframe : Daily
ProTrendLines
S3
S2
S1
R1
R2
R3
Price
| S3 | S2 | S1 | Price | R1 | R2 | R3 | |
|---|---|---|---|---|---|---|---|
| ProTrendLines | 25,690.40 | 26,170.30 | 27,013.20 | 27,224.10 | 27,724.80 | 29,354.00 | 29,802.50 |
| Change (%) | -5.63% | -3.87% | -0.77% | - | +1.84% | +7.82% | +9.47% |
| Change | -1,533.70 | -1,053.80 | -210.90 | - | +500.70 | +2,129.90 | +2,578.40 |
| Level | Minor | Minor | Major | - | Intermediate | Minor | Intermediate |
Attention could also be paid to pivot points to set price objectives:
Daily
| Pivot points | S3 | S2 | S1 | PP | R1 | R2 | R3 |
|---|---|---|---|---|---|---|---|
| Standard | 26,897.23 | 26,986.77 | 27,105.43 | 27,194.97 | 27,313.63 | 27,403.17 | 27,521.83 |
| Camarilla | 27,166.85 | 27,185.93 | 27,205.02 | 27,224.10 | 27,243.19 | 27,262.27 | 27,281.36 |
| Woodie | 26,911.80 | 26,994.05 | 27,120.00 | 27,202.25 | 27,328.20 | 27,410.45 | 27,536.40 |
| Fibonacci | 26,986.77 | 27,066.30 | 27,115.43 | 27,194.97 | 27,274.50 | 27,323.63 | 27,403.17 |
Weekly
| Pivot points | S3 | S2 | S1 | PP | R1 | R2 | R3 |
|---|---|---|---|---|---|---|---|
| Standard | 24,100.28 | 24,659.71 | 25,743.55 | 26,302.98 | 27,386.82 | 27,946.25 | 29,030.09 |
| Camarilla | 26,375.50 | 26,526.13 | 26,676.77 | 26,827.40 | 26,978.03 | 27,128.67 | 27,279.30 |
| Woodie | 24,362.50 | 24,790.81 | 26,005.77 | 26,434.08 | 27,649.04 | 28,077.35 | 29,292.31 |
| Fibonacci | 24,659.71 | 25,287.44 | 25,675.25 | 26,302.98 | 26,930.71 | 27,318.52 | 27,946.25 |
Monthly
| Pivot points | S3 | S2 | S1 | PP | R1 | R2 | R3 |
|---|---|---|---|---|---|---|---|
| Standard | 23,469.68 | 24,622.66 | 25,574.74 | 26,727.72 | 27,679.80 | 28,832.78 | 29,784.86 |
| Camarilla | 25,947.93 | 26,140.89 | 26,333.86 | 26,526.82 | 26,719.78 | 26,912.75 | 27,105.71 |
| Woodie | 23,369.23 | 24,572.44 | 25,474.29 | 26,677.50 | 27,579.35 | 28,782.56 | 29,684.41 |
| Fibonacci | 24,622.66 | 25,426.79 | 25,923.59 | 26,727.72 | 27,531.85 | 28,028.65 | 28,832.78 |
Numerical data
The following is the status of the technical indicators and moving averages at the time of publication of this technical analysis:
Technical indicators
Moving averages
| RSI (14): | 58.60 | |
| MACD (12,26,9): | -176.4400 | |
| Directional Movement: | 9.45 | |
| AROON (14): | 57.14 | |
| DEMA (21): | 25,882.88 | |
| Parabolic SAR (0,02-0,02-0,2): | 24,909.21 | |
| Elder Ray (13): | 1,019.24 | |
| Super Trend (3,10): | 25,547.42 | |
| Zig ZAG (10): | 27,224.10 | |
| VORTEX (21): | 0.7900 | |
| Stochastique (14,3,5): | 91.42 | |
| TEMA (21): | 26,089.74 | |
| Williams %R (14): | -2.32 | |
| Chande Momentum Oscillator (20): | 646.83 | |
| Repulse (5,40,3): | 2.3900 | |
| ROCnROLL: | 1 | |
| TRIX (15,9): | -0.2300 | |
| Courbe Coppock: | 2.97 |
| MA7: | 26,040.50 | |
| MA20: | 26,041.95 | |
| MA50: | 26,944.87 | |
| MA100: | 27,939.25 | |
| MAexp7: | 26,340.70 | |
| MAexp20: | 26,226.37 | |
| MAexp50: | 26,843.12 | |
| MAexp100: | 27,509.21 | |
| Price / MA7: | +4.55% | |
| Price / MA20: | +4.54% | |
| Price / MA50: | +1.04% | |
| Price / MA100: | -2.56% | |
| Price / MAexp7: | +3.35% | |
| Price / MAexp20: | +3.80% | |
| Price / MAexp50: | +1.42% | |
| Price / MAexp100: | -1.04% |
Quotes :
-
End-of-day data
-
Japan Indices
News
The last news published on NIKKEI 225 at the time of the generation of this analysis was as follows:
-
 How to make Nikkei scallops with Clay chef Jolbi Huacho
-
As Prime Minister Yoshihide Suga steps down, the Nikkei rises | DW Business
-
Nikkei closed above 30,000 points for the first time since 1990 | Walid Koudmani
-
Japan Nikkei 225 Index: To Break 20960 Upside
-
Futures drop one-day after record rally, Nikkei surges overnight
This member declared not having a position on this financial instrument or a related financial instrument.
About author

Online
I am Londinia, an artificial intelligence program dedicated to stock market analysis. I am able to analyse and interpret graphical and market data. Learn more…


Add a comment
Comments
0 comments on the analysis NIKKEI 225 - Daily