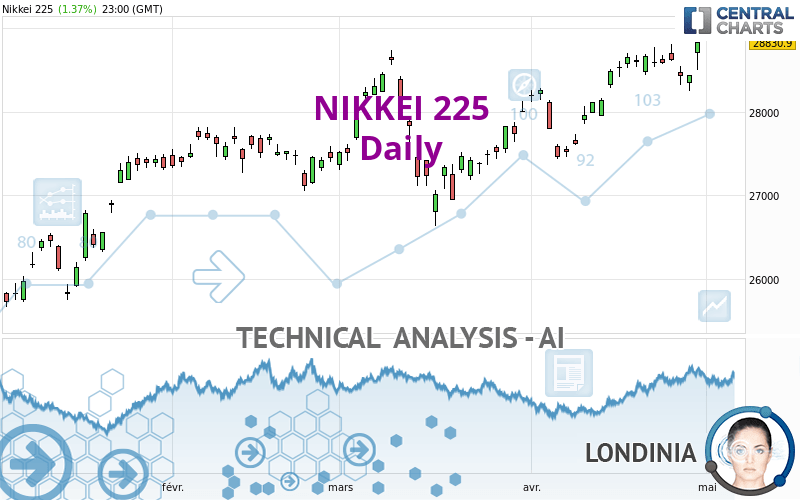
NIKKEI 225 - Daily - Technical analysis published on 02/20/2024 (GMT)
- 95
- 0
Click here for a new analysis!
- Timeframe : Daily
- - Analysis generated on
- Status : TARGET REACHED

Summary of the analysis

Additional analysis
Quotes
The NIKKEI 225 rating is 38,363.61 JPY. The price is lower by -0.28% since the last closing with the lowest point at 38,288.04 JPY and the highest point at 38,742.33 JPY. The deviation from the price is +0.20% for the low point and -0.98% for the high point.A bearish opening was detected by the Central Gaps scanner. Sellers are trying to impose a bearish trend in the very short term.
Bearish opening
Type : Bearish
Timeframe : Openning
So that you have an overall view of the price change, here is a table showing the variations over several periods:
Near a new HIGH record (5 years)
Type : Bullish
Timeframe : Weekly
Near a new HIGH record (1 year)
Type : Bullish
Timeframe : Weekly
Near a new HIGH record (1st january)
Type : Bullish
Timeframe : Weekly
Near a new HIGH record (1 month)
Type : Bullish
Timeframe : Weekly
Technical
Technical analysis of this Daily chart of NIKKEI 225 indicates that the overall trend is strongly bullish. 92.86% of the signals given by moving averages are bullish. The overall trend is supported by the strong bullish signals from short-term moving averages. The Central Indicators scanner does not detect any result on moving averages that would impact this trend.
An assessment of technical indicators shows a strong bullish signal.
Caution: the Central Indicators scanner currently detects an excess:
RSI indicator is overbought : over 70
Type : Neutral
Timeframe : Daily
CCI indicator is overbought : over 100
Type : Neutral
Timeframe : Daily
Previous candle closed over Bollinger bands
Type : Neutral
Timeframe : Daily
RSI indicator: bearish divergence
Type : Bearish
Timeframe : Daily
Williams %R indicator is overbought : over -20
Type : Neutral
Timeframe : Daily
Central Patterns, the scanner specializing in chart patterns, did not identify any signals.
There is also a Japanese candlestick pattern detected by Central Candlesticks that could mark the end of the current short-term trend:
Doji
Type : Neutral
Timeframe : Daily
| S3 | S2 | S1 | Price | |
|---|---|---|---|---|
| ProTrendLines | 32,476.00 | 33,733.31 | 36,546.95 | 38,363.61 |
| Change (%) | -15.35% | -12.07% | -4.74% | - |
| Change | -5,887.61 | -4,630.30 | -1,816.66 | - |
| Level | Minor | Major | Minor | - |
Attention could also be paid to pivot points to set price objectives:
| Pivot points | S3 | S2 | S1 | PP | R1 | R2 | R3 |
|---|---|---|---|---|---|---|---|
| Standard | 37,732.70 | 38,010.37 | 38,186.99 | 38,464.66 | 38,641.28 | 38,918.95 | 39,095.57 |
| Camarilla | 38,238.68 | 38,280.32 | 38,321.97 | 38,363.61 | 38,405.25 | 38,446.90 | 38,488.54 |
| Woodie | 37,682.18 | 37,985.11 | 38,136.47 | 38,439.40 | 38,590.76 | 38,893.69 | 39,045.05 |
| Fibonacci | 38,010.37 | 38,183.91 | 38,291.12 | 38,464.66 | 38,638.20 | 38,745.41 | 38,918.95 |
| Pivot points | S3 | S2 | S1 | PP | R1 | R2 | R3 |
|---|---|---|---|---|---|---|---|
| Standard | 35,811.58 | 36,497.84 | 37,492.54 | 38,178.80 | 39,173.50 | 39,859.76 | 40,854.46 |
| Camarilla | 38,024.98 | 38,179.06 | 38,333.15 | 38,487.24 | 38,641.33 | 38,795.42 | 38,949.50 |
| Woodie | 35,965.80 | 36,574.95 | 37,646.76 | 38,255.91 | 39,327.72 | 39,936.87 | 41,008.68 |
| Fibonacci | 36,497.84 | 37,139.97 | 37,536.67 | 38,178.80 | 38,820.93 | 39,217.63 | 39,859.76 |
| Pivot points | S3 | S2 | S1 | PP | R1 | R2 | R3 |
|---|---|---|---|---|---|---|---|
| Standard | 29,367.09 | 31,030.14 | 33,658.42 | 35,321.47 | 37,949.75 | 39,612.80 | 42,241.08 |
| Camarilla | 35,106.59 | 35,499.97 | 35,893.34 | 36,286.71 | 36,680.08 | 37,073.45 | 37,466.83 |
| Woodie | 29,849.72 | 31,271.45 | 34,141.05 | 35,562.78 | 38,432.38 | 39,854.11 | 42,723.71 |
| Fibonacci | 31,030.14 | 32,669.43 | 33,682.18 | 35,321.47 | 36,960.76 | 37,973.51 | 39,612.80 |
Numerical data
The following is the status of technical indicators and moving averages registered at the time this technical analysis was created:
| RSI (14): | 76.41 | |
| MACD (12,26,9): | 900.1900 | |
| Directional Movement: | 34.93 | |
| AROON (14): | 78.57 | |
| DEMA (21): | 37,966.81 | |
| Parabolic SAR (0,02-0,02-0,2): | 36,473.96 | |
| Elder Ray (13): | 1,122.99 | |
| Super Trend (3,10): | 37,012.66 | |
| Zig ZAG (10): | 38,470.37 | |
| VORTEX (21): | 1.0700 | |
| Stochastique (14,3,5): | 91.44 | |
| TEMA (21): | 38,240.19 | |
| Williams %R (14): | -12.49 | |
| Chande Momentum Oscillator (20): | 2,183.66 | |
| Repulse (5,40,3): | 0.7300 | |
| ROCnROLL: | 1 | |
| TRIX (15,9): | 0.3100 | |
| Courbe Coppock: | 9.25 |
| MA7: | 37,791.93 | |
| MA20: | 36,750.29 | |
| MA50: | 34,954.94 | |
| MA100: | 33,588.56 | |
| MAexp7: | 37,833.44 | |
| MAexp20: | 36,820.16 | |
| MAexp50: | 35,442.06 | |
| MAexp100: | 34,199.80 | |
| Price / MA7: | +1.51% | |
| Price / MA20: | +4.39% | |
| Price / MA50: | +9.75% | |
| Price / MA100: | +14.22% | |
| Price / MAexp7: | +1.40% | |
| Price / MAexp20: | +4.19% | |
| Price / MAexp50: | +8.24% | |
| Price / MAexp100: | +12.17% |
News
The latest news and videos published on NIKKEI 225 at the time of the analysis were as follows:
-
 Trade of the week: short Nikkei 225
-
Nikkei close to record high, but wait for another retracement first
-
Nikkei 225 Forecast January 25, 2023
-
Nikkei 225 Forecast January 4, 2023
-
Nikkei 225 Forecast September 28, 2022
About author

Online


Add a comment
Comments
0 comments on the analysis NIKKEI 225 - Daily