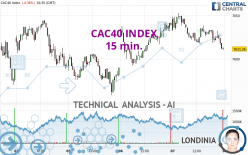
CAC40 INDEX - 15 min. - Technical analysis published on 02/08/2024 (GMT)
- 105
- 0
Click here for a new analysis!
- Timeframe : 15 min.
- - Analysis generated on
- Status : INVALID
Summary of the analysis

Additional analysis
Quotes
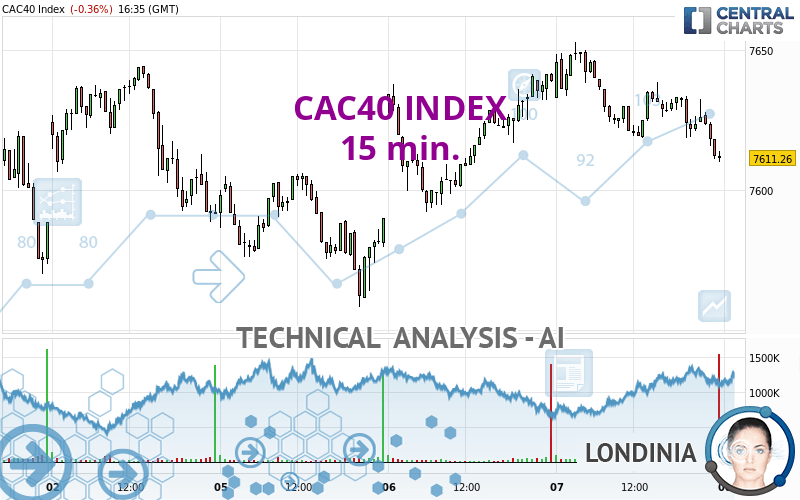
The CAC40 INDEX price is 7,611.26 EUR. The price is lower by -0.36% since the last closing and was traded between 7,610.18 EUR and 7,652.85 EUR over the period. The price is currently at +0.01% from its lowest and -0.54% from its highest.The Central Gaps scanner detects a bearish opening marking the presence of sellers ahead of buyers at the opening but not sufficiently marked to allow the price to register a quotation gap.
Bearish opening
Type : Bearish
Timeframe : Openning
Here is a more detailed summary of the historical variations registered by CAC40 INDEX:
Near a new HIGH record (5 years)
Type : Bullish
Timeframe : Weekly
Near a new HIGH record (1 year)
Type : Bullish
Timeframe : Weekly
Near a new LOW record (1st january)
Type : Bearish
Timeframe : Weekly
Near a new LOW record (1 month)
Type : Bearish
Timeframe : Weekly
Technical
A technical analysis in 15 min. of this CAC40 INDEX chart shows a bearish trend. The signals given by moving averages are 67.86% bearish. This bearish trend is reinforced by the strong signals currently being given by short-term moving averages. An assessment of moving averages reveals a bearish signal that could impact this trend:
Bearish trend reversal : Moving Average 50
Type : Bearish
Timeframe : 15 minutes
The probability of a further decline is high given the direction of the technical indicators.
Caution: the Central Indicators scanner currently detects an excess:
CCI indicator is oversold : under -100
Type : Neutral
Timeframe : 15 minutes
Previous candle closed under Bollinger bands
Type : Neutral
Timeframe : 15 minutes
RSI indicator: bullish divergence
Type : Bullish
Timeframe : 15 minutes
Williams %R indicator is oversold : under -80
Type : Neutral
Timeframe : 15 minutes
Central Patterns, the scanner specializing in chart patterns, did not identify any signals.
Central Candlesticks, the scanner specialised in Japanese candlesticks, detects these signals that could have an impact on the current short-term trend:
Bullish harami
Type : Bullish
Timeframe : 15 minutes
Doji
Type : Neutral
Timeframe : 15 minutes
| S3 | S2 | S1 | Price | R1 | |
|---|---|---|---|---|---|
| ProTrendLines | 7,382.52 | 7,495.84 | 7,577.00 | 7,611.26 | 7,677.47 |
| Change (%) | -3.01% | -1.52% | -0.45% | - | +0.87% |
| Change | -228.74 | -115.42 | -34.26 | - | +66.21 |
| Level | Major | Major | Major | - | Major |
Pivot points can also be used to set your price objectives. Here is the price situation in relation to pivot points:
| Pivot points | S3 | S2 | S1 | PP | R1 | R2 | R3 |
|---|---|---|---|---|---|---|---|
| Standard | 7,554.01 | 7,582.09 | 7,596.68 | 7,624.76 | 7,639.35 | 7,667.43 | 7,682.02 |
| Camarilla | 7,599.53 | 7,603.44 | 7,607.35 | 7,611.26 | 7,615.17 | 7,619.08 | 7,622.99 |
| Woodie | 7,547.26 | 7,578.72 | 7,589.93 | 7,621.39 | 7,632.60 | 7,664.06 | 7,675.27 |
| Fibonacci | 7,582.09 | 7,598.39 | 7,608.46 | 7,624.76 | 7,641.06 | 7,651.13 | 7,667.43 |
| Pivot points | S3 | S2 | S1 | PP | R1 | R2 | R3 |
|---|---|---|---|---|---|---|---|
| Standard | 7,407.69 | 7,488.88 | 7,540.57 | 7,621.76 | 7,673.45 | 7,754.64 | 7,806.33 |
| Camarilla | 7,555.72 | 7,567.90 | 7,580.08 | 7,592.26 | 7,604.44 | 7,616.62 | 7,628.80 |
| Woodie | 7,392.94 | 7,481.51 | 7,525.82 | 7,614.39 | 7,658.70 | 7,747.27 | 7,791.58 |
| Fibonacci | 7,488.88 | 7,539.64 | 7,571.00 | 7,621.76 | 7,672.52 | 7,703.88 | 7,754.64 |
| Pivot points | S3 | S2 | S1 | PP | R1 | R2 | R3 |
|---|---|---|---|---|---|---|---|
| Standard | 6,969.07 | 7,125.08 | 7,390.92 | 7,546.93 | 7,812.77 | 7,968.78 | 8,234.62 |
| Camarilla | 7,540.74 | 7,579.41 | 7,618.08 | 7,656.75 | 7,695.42 | 7,734.09 | 7,772.76 |
| Woodie | 7,023.98 | 7,152.54 | 7,445.83 | 7,574.39 | 7,867.68 | 7,996.24 | 8,289.53 |
| Fibonacci | 7,125.08 | 7,286.23 | 7,385.79 | 7,546.93 | 7,708.08 | 7,807.64 | 7,968.78 |
Numerical data
The following is the status of the technical indicators and moving averages at the time of publication of this technical analysis:
| RSI (14): | 37.21 | |
| MACD (12,26,9): | -3.8600 | |
| Directional Movement: | -12.10 | |
| AROON (14): | -85.72 | |
| DEMA (21): | 7,619.66 | |
| Parabolic SAR (0,02-0,02-0,2): | 7,631.59 | |
| Elder Ray (13): | -8.90 | |
| Super Trend (3,10): | 7,632.33 | |
| Zig ZAG (10): | 7,611.26 | |
| VORTEX (21): | 0.9100 | |
| Stochastique (14,3,5): | 1.57 | |
| TEMA (21): | 7,614.93 | |
| Williams %R (14): | -96.22 | |
| Chande Momentum Oscillator (20): | -18.35 | |
| Repulse (5,40,3): | -0.1600 | |
| ROCnROLL: | 2 | |
| TRIX (15,9): | 0.0000 | |
| Courbe Coppock: | 0.28 |
| MA7: | 7,622.20 | |
| MA20: | 7,505.28 | |
| MA50: | 7,481.80 | |
| MA100: | 7,276.78 | |
| MAexp7: | 7,617.61 | |
| MAexp20: | 7,623.71 | |
| MAexp50: | 7,624.16 | |
| MAexp100: | 7,621.40 | |
| Price / MA7: | -0.14% | |
| Price / MA20: | +1.41% | |
| Price / MA50: | +1.73% | |
| Price / MA100: | +4.60% | |
| Price / MAexp7: | -0.08% | |
| Price / MAexp20: | -0.16% | |
| Price / MAexp50: | -0.17% | |
| Price / MAexp100: | -0.13% |
News
Don't forget to follow the news on CAC40 INDEX. At the time of publication of this analysis, the latest news was as follows:
-
 CAC Forecast January 18, 2023
-
CAC (France 40) Forecast January 13, 2023
-
CAC Forecast January 11, 2023
-
DAX and CAC Forecast July 15, 2022
-
DAX and CAC Forecast July 5, 2022
About author

Online


Add a comment
Comments
0 comments on the analysis CAC40 INDEX - 15 min.